Data Science Venn Diagram – Know what it takes to become a Data Scientist
Basically, Data Science is a field that involves the study of data for some important inferences for many different purposes. Data Science is not one single domain. Several fields together make Data Science.
For applying Data Science, knowledge of many diverse skills is required which you will learn in the Data Science Venn diagram.
Also, Data Science involves many different roles, that is, a Data Scientist needs to perform many tasks like assemble data, prepare data, analyze data, prepare models, evaluate models, predict results and whatnot.
After knowing that a Data Scientist needs to perform so many tasks many people are building a misconception that you need to master a large number of skills to be a Data Scientist.
For providing a clear thought for this ideology the Data Science Venn diagram was proposed.
Data Science Venn Diagram
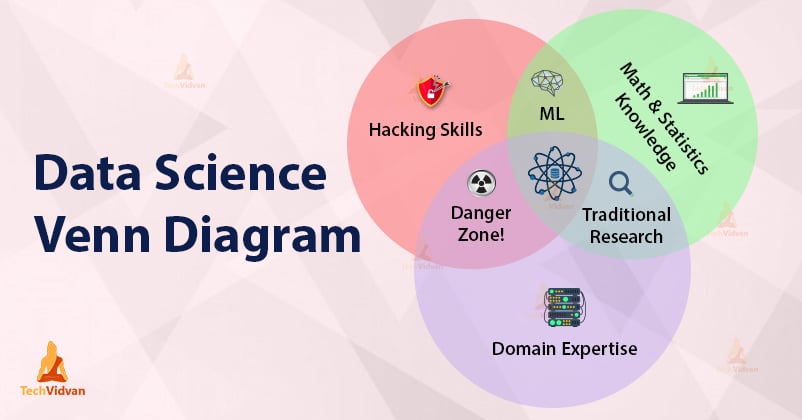
Drew Conway is the guy who came up with the idea of the Data Science Venn Diagram. The diagram tells you about what skills are required for being a Data Scientist.
He believed that Data Science is made up of mainly three things and represented them in the form of a Venn Diagram indicating their individual roles.
These basic things are:
- Math and Statistics
- Computer Programming
- Domain Knowledge
Data Science is in the middle of this Venn Diagram combining all these skills. The Data Science Venn Diagram gives the visual representation of how these areas work together in Data Science.
To have a better understanding of this Data Science Venn diagram, let us one by one understand how these skills are important in Data Science.
1. Hacking Skills
Hacking requires great coding skills. Coding is important because it helps you to gather and prepare the data because a lot of data is unstructured or present in unusual formats. You also require programming skills to apply statistics to your problems, handle the database, etc. One with hacking skills can apply very complex algorithms by computer programming.
As the demand for Data Science is increasing in the market and there is a lot of competition, to stand alone in the crowd you need to be a good hacker. That means you must have the ability to manipulate the data in such a way that gives the best results to any problem.
Hacking skills will help you to work very creatively with the data and different algorithms to derive some innovative results.
2. Math and Statistics Knowledge
After collecting and preparing the data, now comes the part of extracting the insights from it. Mathematics is important for analyzing the data.
For analyzing the data, you will require several tools from mathematics such as probability, algebra, etc. It helps in the diagnosis of the problem by applying various mathematical and statistical approaches to your data.
The reason that mathematics is so important because it helps you to choose the procedure to solve your problems depending on the data that you have.
3. Domain Expertise
For applying Data Science, you need to have an understanding of the right questions to ask to collect the data and discover insights from it.
Domain Expertise means the knowledge of the particular field in which you are working. It may be business, healthcare, Finance, Education, etc. You must know about the goals of that field, various methods, and constraints that you will be dealing with.
Thus, having familiarity with the field will help you to implement Data Science to your problems more easily and impactfully.
Scrutinizing Data Science Venn Diagram
In the Data Science Venn Diagram, there are some areas that include the intersection of these skills which are Machine Learning, Traditional Research, and Danger Zone.
Let us talk about each of these.
1. Machine Learning
According to the Data Science Venn Diagram, Machine learning involves the knowledge of Computer programming and Math but without any domain expertise.
This means that you just need to throw your data into the model without necessarily knowing about the details of the data such as what data is, what it means etc. and it will give you some results.
2. Traditional Research
This area represents that you have the knowledge of math, statistics and you are an expert in your domain but do not know coding or programming. But this is not that big problem here, because the data that you use in Traditional Research is highly structured. Thus you don’t need to worry about preparing the data because the data is ready for analysis.
Traditional Research simplifies your task by allowing you to focus completely on the analysis of data and extracting the insights out of it.
3. Danger Zone
As the name suggests, it is the most dangerous area of the Data Science Venn diagram.
Danger Zone is the combination of coding and domain knowledge but without Math and Statistics. When Drew Conway proposed this Data Science Venn Diagram, he believed that this is the rarest case and is most unlikely to happen.
Let us understand this by some examples like word counts, maps, etc. These do not involve any Math or Statistics but still, it can be very informative and useful.
After having a look at all the elements of this diagram, we can say that people from different backgrounds can try their hands in Data Science such as coders who have knowledge of math, stats, and business.
Statisticians who can code and have basic business skills and Business people who have the knowledge of programming and mathematics can try their hands in Data Science.
If you are from such a background that involves the knowledge of these basic skills then you can begin your journey with Data Science.
Summary
We conclude that, according to the Data Science Venn Diagram, the application of Data Science requires several basic skills which are Mathematics, Programming, and Domain Expertise. The diagram gives an overview of how these skills are combined in data science.
If you are from such a background that involves the knowledge of these basic skills then you can begin your journey with Data Science.