Graphical Models Applications in Real Life [Case Study Included]
In our previous article about probabilistic graphical models, we learned what graphical models are. In this tutorial, of Techvidvan’s R tutorial series, we are going to discuss the various applications of graphical models in real life. Many different fields find applications of graphical models in their day-to-day workings. Let’s take a look at how these industries find the use of graphical models.
Graphical Models Applications in Real Life

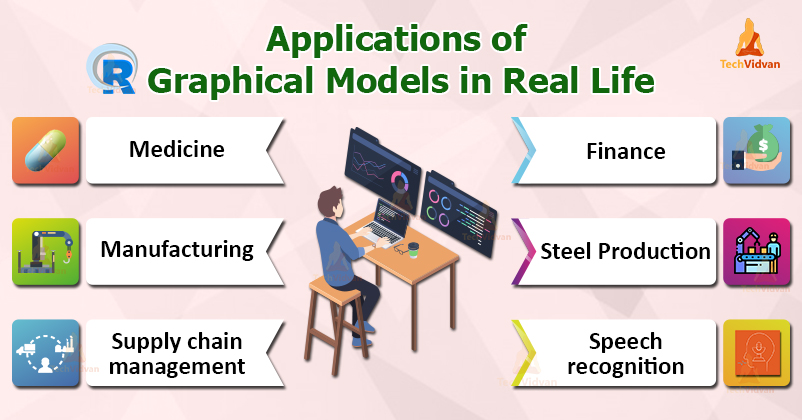
From manufacturing industries to the medical and bioengineering, from supply chain management to finance, many industries have found various applications of probabilistic graphical models(PGM).
Here are a few examples:
1. Medicine
PGM’s are great tools to calculate the probability of an event based on the knowledge that may not be completely reliable. Thus, they help greatly in the diagnosis process. They also help in genetic inheritance analysis. PGM’s use probabilities and the sequence of events to reach likely conclusions. They are also very useful for causal predictions. Therefore, they are also used to predict the causes of current symptoms the patient might be showing.
2. Manufacturing
Reducing production costs and improving the quality of the manufactured products is a constant goal of the manufacturing industry. This is possible by running all production systems at optimized parameters. Probabilistic graphical models are very useful in solving such min-maxing problems.
3. Supply chain management
Any supply chain faces problems like choosing the most cost-effective way of delivering goods to their destination, choosing the appropriate destinations according to the predicted demands, choosing appropriate routes for delivering the goods that will minimize delivering costs and maximize the safety of the goods. Probabilistic graphical models are ideal for solving such problems.
4. Finance
Probabilistic graphical models are also very useful for representing financial information. They can also help in predicting the outcomes of various financial decisions. Suppose a finance firm is planning on launching a new loan scheme. They can use PGM’s to predict what might be the effects of the scheme on their company.
5. Steel Production
In this environment-conscious economy, the manufacturing industry has to very carefully map their footprint and impact on the environment. The steel production industry has to calculate their CO2 emissions for the deoxidation process of steel. Probabilistic graphical models are helpful in calculating that.
6. Telecommunication Network Diagnosis
The telecom industry has to very carefully plan their network layouts and then engineer them equally carefully. Yet no system is without faults. Probabilistic graphical models are used in the telecommunication industry to diagnose their network and system layout for faults in them. They are also used to predict the causes of various issues and failures.
7. Object Recognition in Images
Probabilistic graphical models are also very helpful in building encoding frameworks. They can provide the statistical structures of visual scenes. Thus, they provide the basis for building object recognition and computer vision models.
8. Handwriting recognition
Handwriting recognition is one of the most widely used applications of object recognition. Probabilistic graphical models provide a basis to build reliable handwriting recognition models that are accurate and light-weight at the same time.
9. Speech recognition
Many pattern recognition techniques used in speech recognition like Gaussian distributions, decision trees, factor analysis, etc. can be depicted using a graph. Many speech recognition algorithms are born directly out of the field of graphical models.
10. Natural language processing
Imagine that every word in a language has a numerical weight. When building a sentence, we use different words in different combinations. If we calculate the weight of the words used relative to the positions they are used in, this can lead us to a numerical value corresponding to the sentence. This is a common approach used in natural language processing. Probabilistic graphical models are very helpful in predicting meaning based on unclear probabilistic distributions.
Case study: Netflix’s Recommendation Engine
Movie and media recommendations are not an uncommon feature on websites and media services these days. However, they were cutting edge technology in 2008 when Netflix first came up with it on their brand new online streaming service. This recommendation engine is still the most advanced once that is out there.
Imagine all the titles on Netflix, as the vertices in their graph. All these vertices have some attributes that contain the metadata of these titles. Similar ratings and attributes result in edges forming between two vertices. These edges are formed using graph diffusion algorithms. This results in a graph connecting all movies and series. The recommendation engine picks the media closest to the recently watched items on their graph and provides these as recommendations to the user. Over the years, their learning algorithms have perfected the diffusion algorithms that connect the media to each other, resulting in better recommendations.
Summary
Probabilistic graphical models are very useful in pattern recognition, problem-solving, and causal predictions. They are used in almost every industry and also in a wide variety of machine learning disciplines.
In this R tutorial, we looked at a few of the real-world applications of probabilistic graphical models. We learned how they are used in the medical field, the manufacturing industry and also for the supply chain management. We also discussed how they are useful in steel production, finance industry and also in telecom engineering. Finally, we looked at their uses in machine learning researches like object recognition, handwriting recognition, speech recognition, etc.. These are just a few applications of probabilistic graphical models.
We hope this article was informative for you.
Now learn to represent data in a condensed form.
Keep learning!!
