Descriptive Statistics in R – Functions to perform statistic measures
In this article of TechVidvan’s R tutorial series, learn about descriptive statistics in R, what are its uses and how we can perform it in R.
We will begin this lesson by learning what descriptive statistics are. We shall then continue on with some basic functions of R that are very useful when it comes to descriptive statistics. Also, learn what data structures these functions process and what function do we have to use for different data structures.
So, without any further ado. Let’s get started!
What is Descriptive Statistics?
Descriptive statistics is the branch of statistics that focuses on describing and gaining more insight into the data in its present state. It deals with what the data in its current state means. It makes the data easier to understand and also gives us knowledge about the data which is necessary to perform further analysis. Average measures like mean, median, mode, etc. are a good example of descriptive statistics.
Descriptive Statistics in R

R programming language provides us with lots of simple yet effective functions to perform descriptive statistics and gain more knowledge about our data. Summarizing the data, calculating average measures, finding out cumulative measures, summarizing rows/columns of data structures, etc. everything is possible with trivial commands. Let’s start simple with the summarizing functions str() and summary().
Summarizing your Data
R provides two very simple functions that can instantly summarize our data for us. These are the str() and the summary() functions.
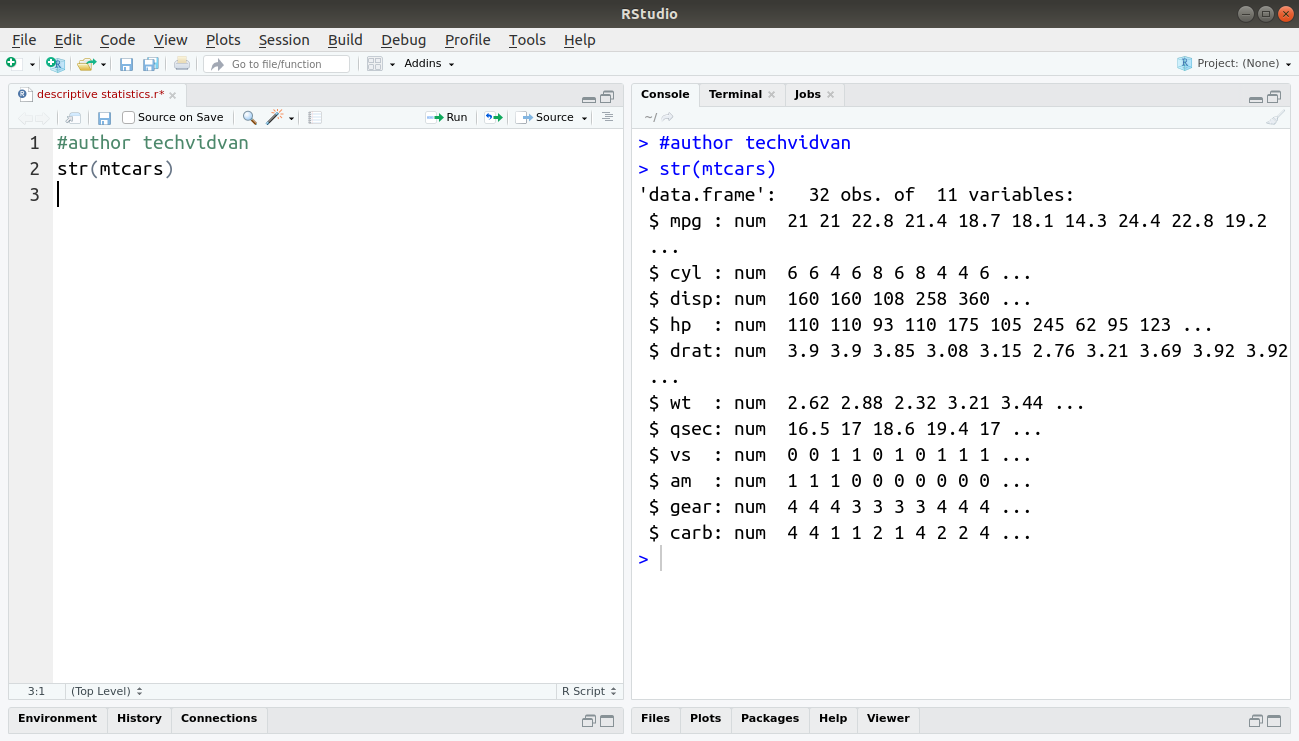
Let us begin with the str function. The str() function takes a single object as an argument and compactly shows us the structure of the input object. It shows us details like length, data type, names and other specifics about the components of the object. Here is an example of the str function.
Code:
str(mtcars)
Output:
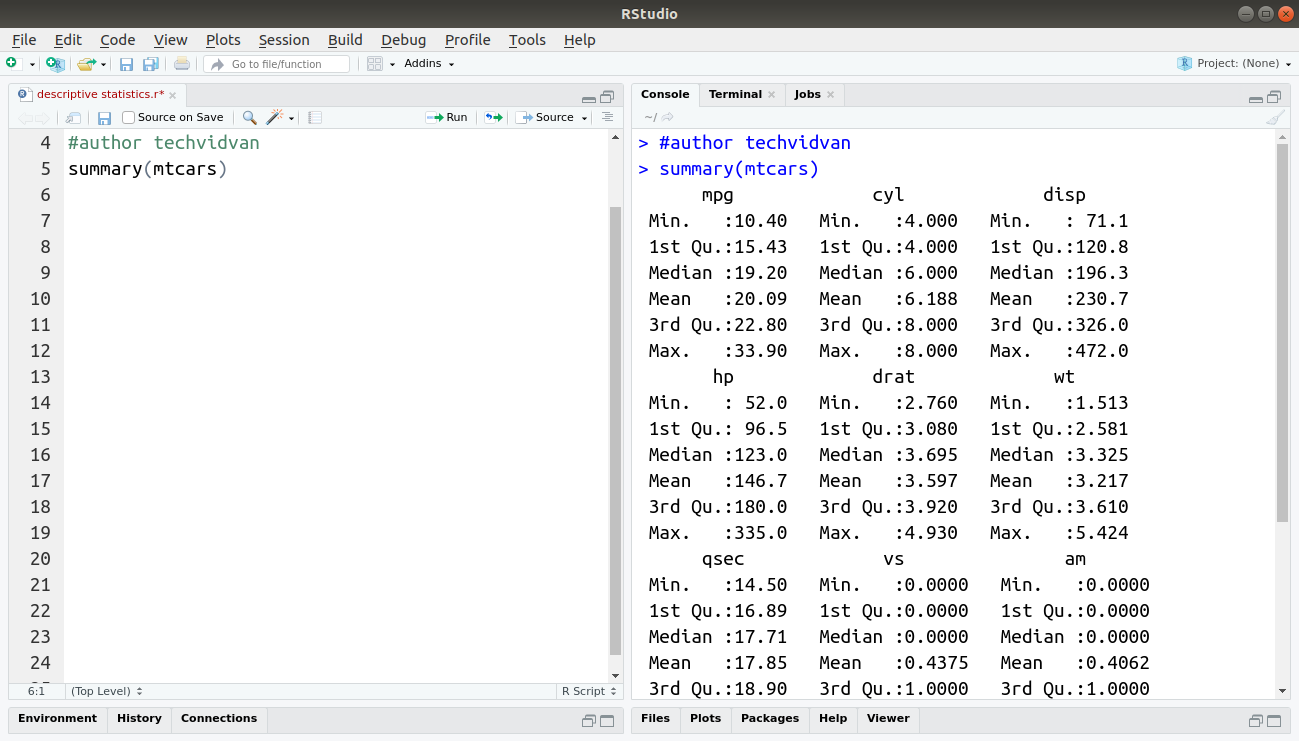
The summary() function also takes a single object as an argument. It then returns the averages measures like mean, median, minimum, maximum, 1st quantile, 3rd quantile, etc. for each component or variable in the object. Here is an example of the summary function in action.
Code:
summary(mtcars)
Output:
Getting the Average Measures
R provides a number of functions that give us different average measures for given data. These average measures include:
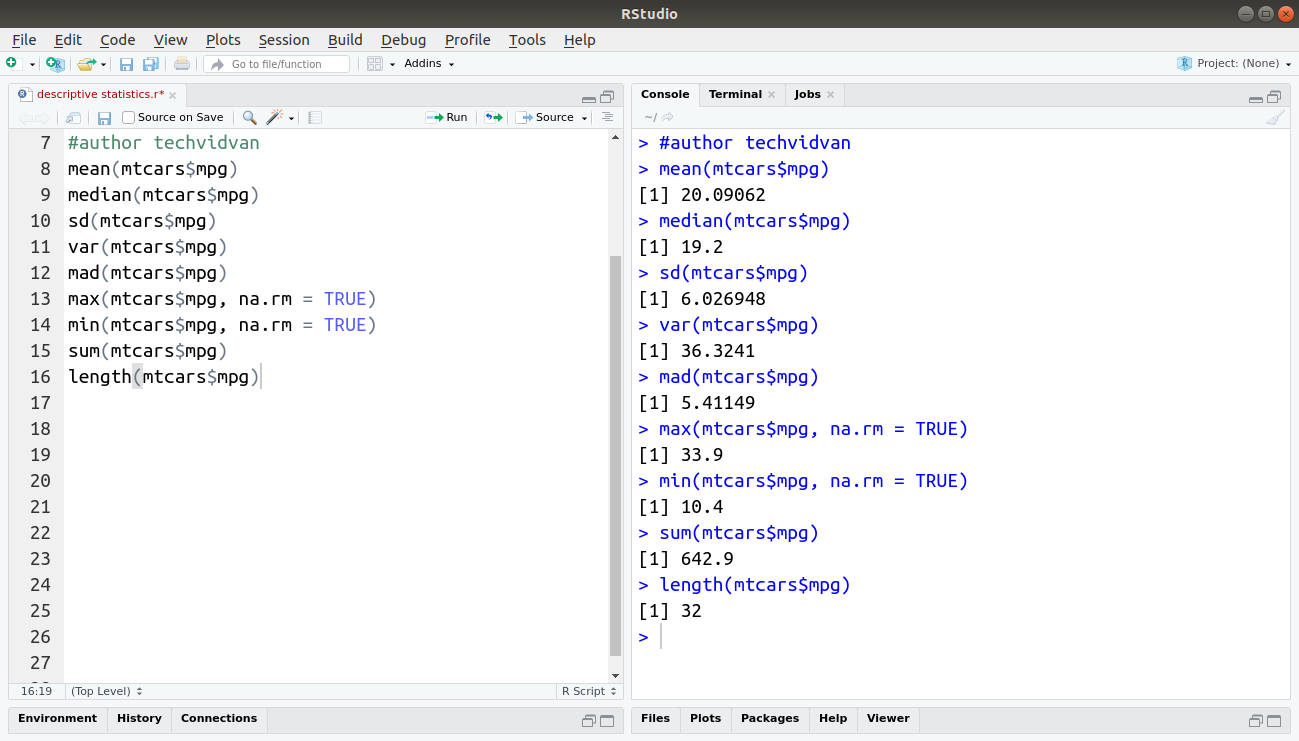
Mean: The mean of a given set of numeric or logical values(it may be a vector or a row or column of any other data structure) can be easily found using the mean() function.
Median: Finding the median of a set of numeric or logical values is also very easy by using the median() function.
Standard deviation: The standard deviation of a set of numerical values can be found using the sd() function.
Variance: the var() function gives us the variance of a set of numeric or logical values.
Median Absolute Variance: The median absolute variance of a set of numeric or logical values can be found by using the mad() function.
Maximum: In a given set of numeric or logical values, we can use the max() function to find the maximum or the largest value in the set.
Note: NA is considered to be the largest by the max() function unless its na.rm argument is set to TRUE.
Minimum: The min() function is a very handy way to find out the smallest value in a set of numeric values.
Note: Like the max() function, the min() function considers NA to be the smallest unless na.rm is set to TRUE.
Sum: The sum of a set of numerical values can be found by simply using the sum() function.
Length: The length or the number of values in a set is given by the length() function.
Code:
mean(mtcars$mpg)
median(mtcars$mpg)
sd(mtcars$mpg)
var(mtcars$mpg)
mad(mtcars$mpg)
max(mtcars$mpg, na.rm = TRUE)
min(mtcars$mpg, na.rm = TRUE)
sum(mtcars$mpg)
length(mtcars$mpg)
Output:
Cumulative measures in R
Cumulative measures are statistical measures that are calculated sequentially. These measures evolve with the data. They provide insight into the progression and growth of the data. R provides a few functions that calculate cumulative measures with ease. These functions are
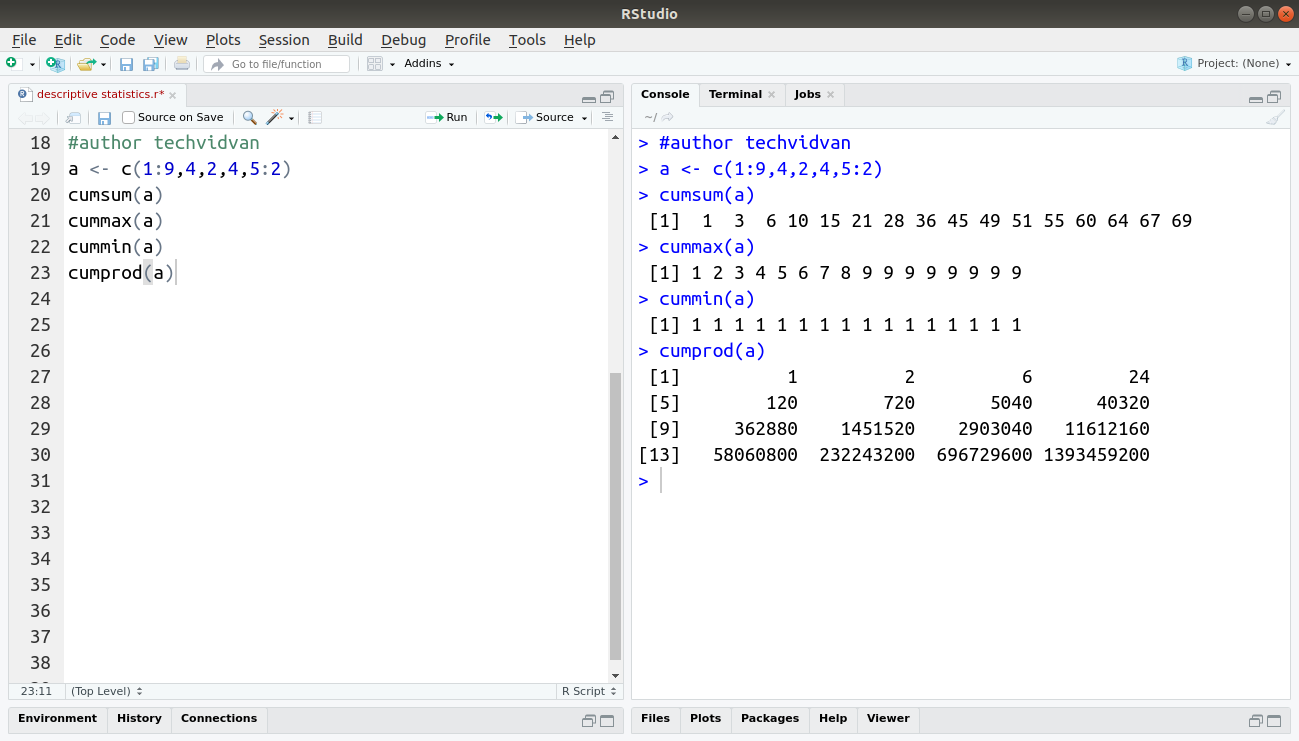
Cumulative sum: The cumsum() function calculates the cumulative sum of a given vector.
Cumulative max: To find the cumulative maximum value of an input vector, you can use the cummax() function.
Cumulative min: You can find the cumulative minimum values in a vector by using the cummin() function.
Cumulative product: Using the comprod() function, you can find the cumulative product of a vector.
Code:
a <- c(1:9,4,2,4,5:2)
cumsum(a)
cummax(a)
cummin(a)
cumprod(a)
Output:
Row and Column Summary Functions in R
There are certain functions in R that give summary statistics for only selected rows or columns of data frames or matrices or any other two or more dimensional data structure.
These functions are:
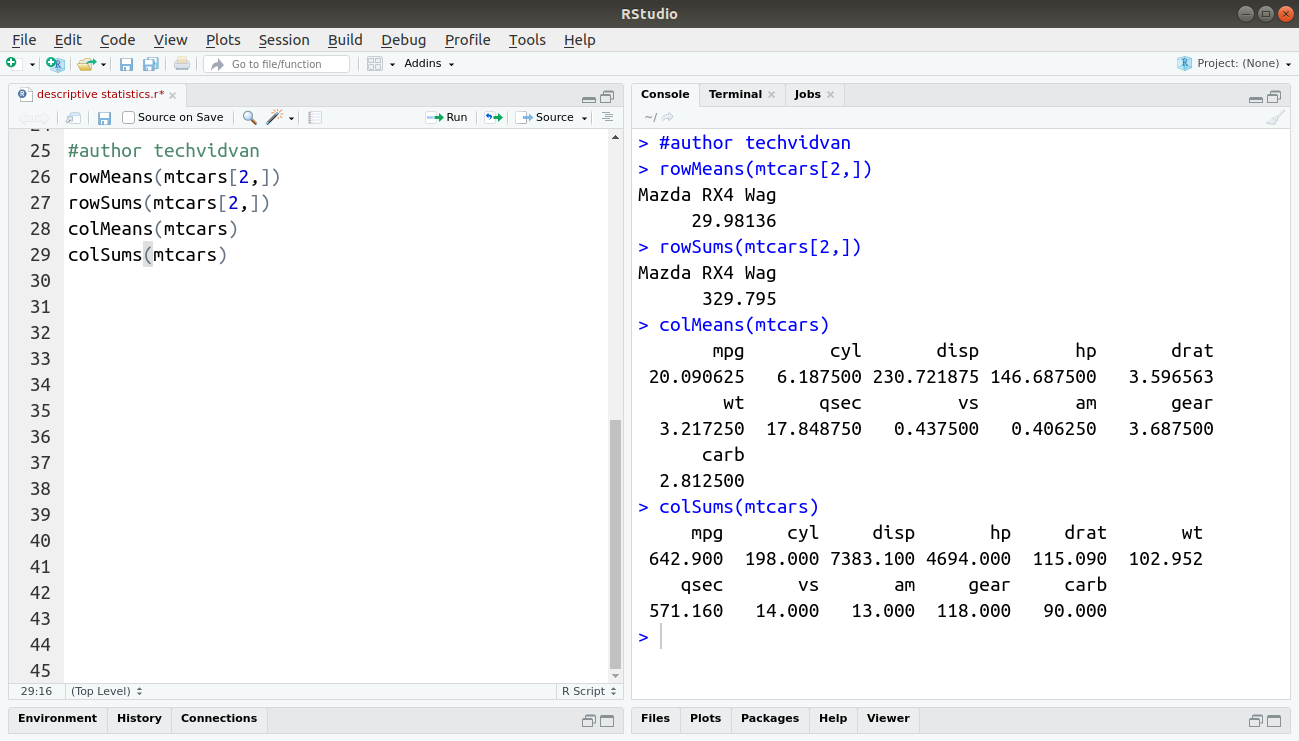
rowMeans: The rowMeans() function, as the name suggests, returns the mean of a selected row of a data structure.
rowSums: The rowSums() function finds the sum of a selected row of a data structure.
colMeans: The colMeans() function returns the mean of a selected column of a data structure.
colSums: The colSums() function calculate the sum of a selected column of a data structure.
Code:
rowMeans(mtcars[2,])
rowSums(mtcars[2,])
colMeans(mtcars)
colSums(mtcars)
Output:
Summary
Descriptive statistics in R do not concern with the impact of the data. It is merely concerned with the current state of the data. It describes the data and gives more detailed knowledge about the data.
In this R tutorial, we learned what descriptive statistics are and how R functions help us to perform descriptive statistic measures on our data to gain more insight into it.
Now, explore top 10 String Manipulation functions to create and modify strings in R.
If you face any difficulty while practicing Descriptive Statistics in R.
Then ask our TechVidvan team in the comment section.
Keep Practicing!!