

Finally, looking to start working on RStudio? Learn the basics before start working with RStudio Tutorial in an easy way.
Before we continue with the basics of R programming, let us get familiar with the IDE we will use for R.
In this RStudio tutorial, we will explore:
- What is RStudio
- Screen Layout of RStudio
- How to import datasets in RStudio
- How to manipulate data in RStudio
- Basic Statistics in RStudio
- How to plot data in RStudio
Are you excited? Then, let’s go!
What is RStudio?
RStudio is an Integrated Development Environment or IDE for the R programming language. It is an open-source software developed by RStudio Inc. It is written in Java, C++, and JavaScript.
RStudio can do complete data analysis using R and other languages. Apart from the R packages, RStudio has many packages of its own that can add to R’s features.
But before reading further it is recommended to install R & RStudio on your system by following our step by step article for R installation.
RStudio Tutorial
First, let’s see how the screen of RStudio looks.
Screen Layout of RStudio
When you open RStudio for the first time you will see a screen something like this:
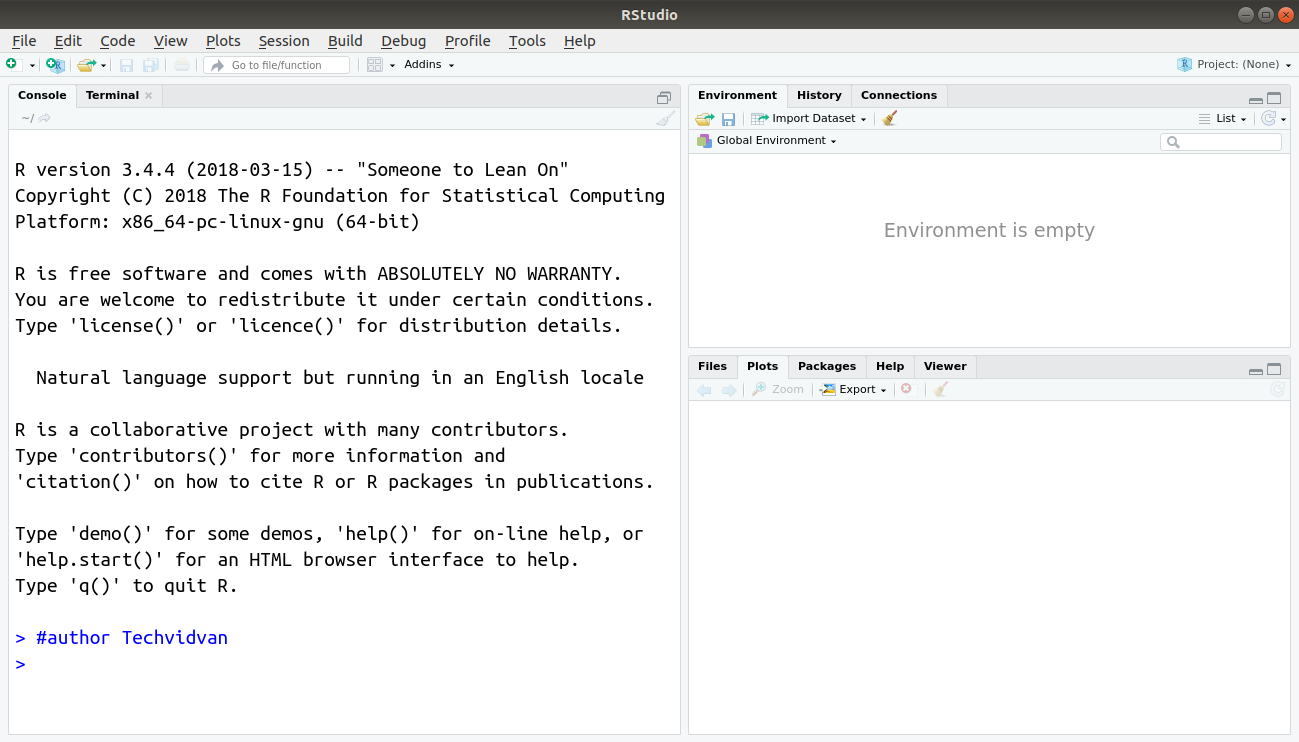
Let us see what these different panels are:
1. On the left half of the screen, are the tabs for the console and the terminal.
- The console is where you can enter R commands, execute them and watch their results.
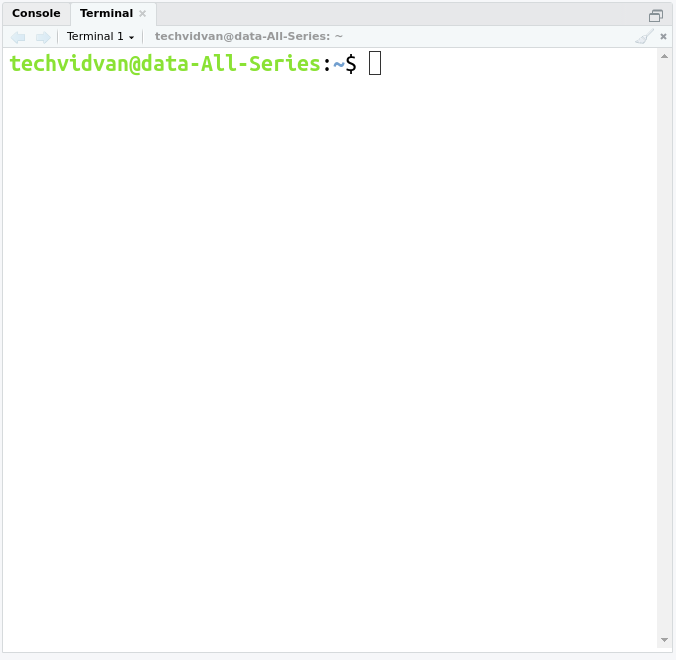
- The terminal provides system shell access from within the IDE. You can access your system terminal (or command prompt/power shell in case of windows) without minimizing windows or leaving the workspace.
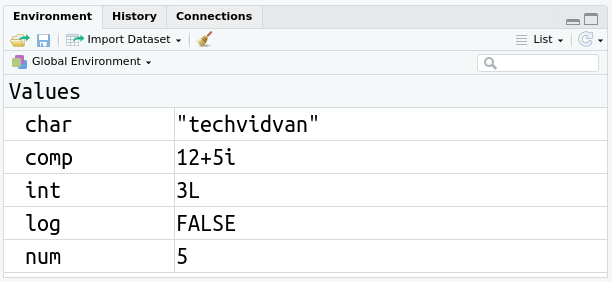
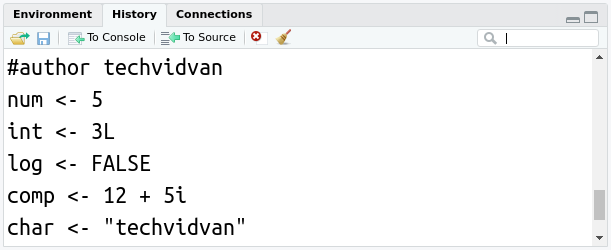
2. On the top right corner of the screen, are the environment, history, and connections tabs.
- The environment tab shows an interactive list of all the loaded R objects.
- The history tab shows you the history of the commands you have used so far.
- The connection tab shows the connections made to different data sources. It lets you track which connections are active and which are not. You can also see what type of connections these are and the properties of the data sources.
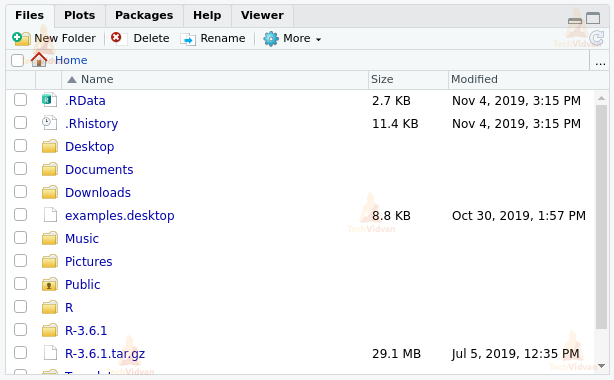
3. On the bottom right corner of the screen, are the files, plots, packages, help, and viewer tabs.
- The files tab shows a file explorer that can navigate the files and directories in the system.
- The plots tab is where the graphical plots and visualizations occur.
- The packages tab shows all the currently active packages in the current session.
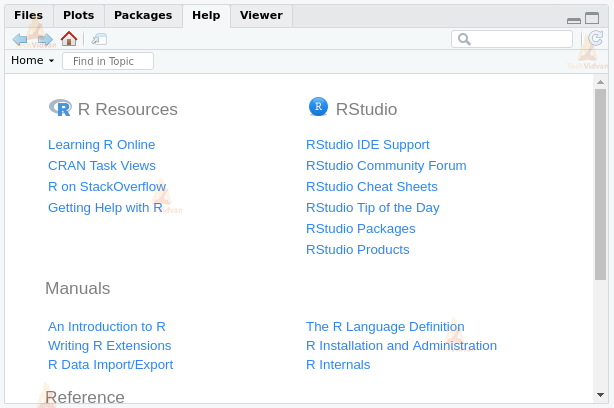
- With the help tab, you can search for commands you need help with. It also has useful links for documentation, forums, books, blogs, packages, and more for R and RStudio.
- The viewer tab lets you view local web content. You can get a preview of the web-apps, HTML pages, or online reports you are making in the viewer.
Basic Data Analysis through RStudio
Now let’s go through some basics of data analysis and how RStudio can make it easy for us. We will be using the features of RStudio to collect some data and create a visual representation of the data. To do that, we will be going through the following steps:
- Import data in RStudio
- Transforming data
- Basic statistics
- Plotting data distribution
1. Importing data in RStudio
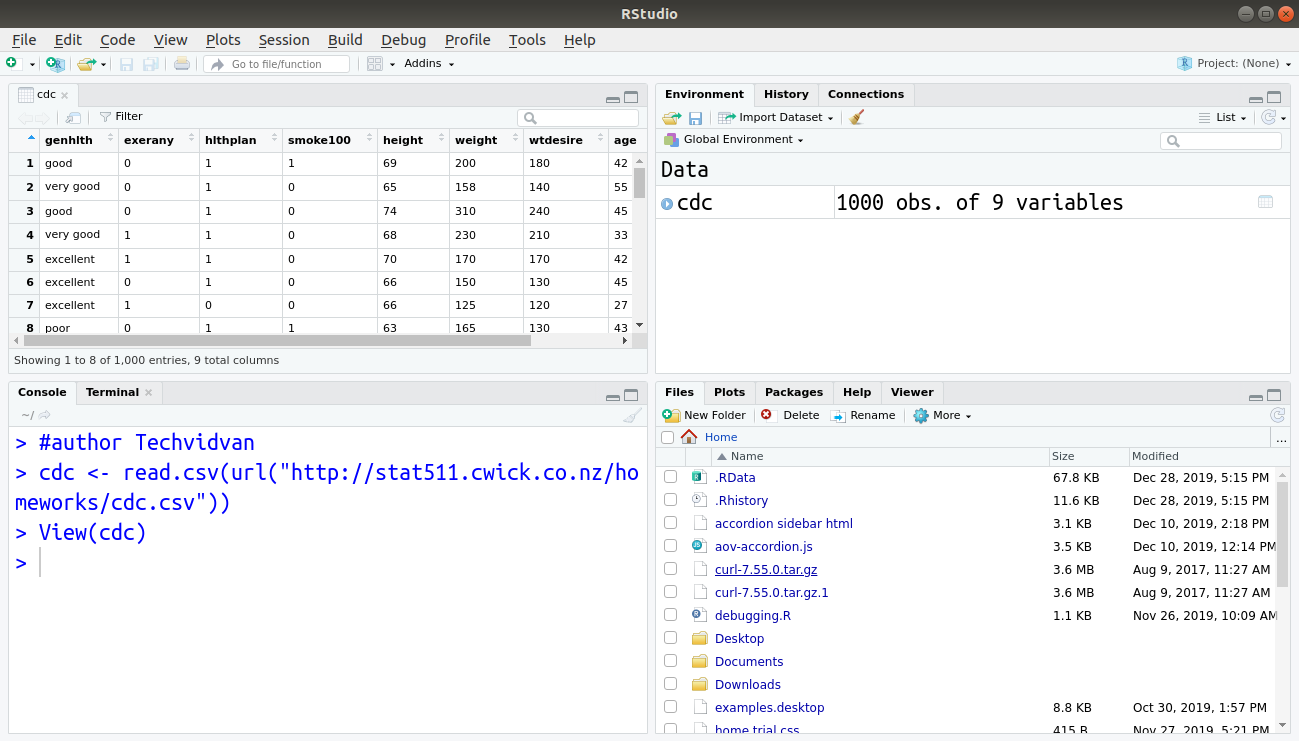
For this tutorial, we will be using this sample census dataset. There are two ways to import data in RStudio. One is to download and import data using the read command.
> cdc <- read.csv(url("http://stat511.cwick.co.nz/homeworks/cdc.csv"))
On executing this command, RStudio will download the dataset read the .csv file and assign it to the variable data.
Note: you can view the data set with the view() command
> View(cdc)
where data is the name of the dataset.
The second way to import data in RStudio is to download the dataset onto your local computer. Then using the import dataset feature.
- Click on the import dataset button on the top in the environment tab. Select the downloaded file and then click open. The Import Dataset dialog box will appear on the screen.

- Set the name and preferences, and click on import. The dataset will be imported into the RStudio and will be assigned to the variable name as set earlier.
2. Manipulating the Data
There are many commands in R and RStudio that can manipulate and transform the data in the desired ways. Let’s check out a few of these.
To access a specific column from the dataset, for eg: height
> cdc$height

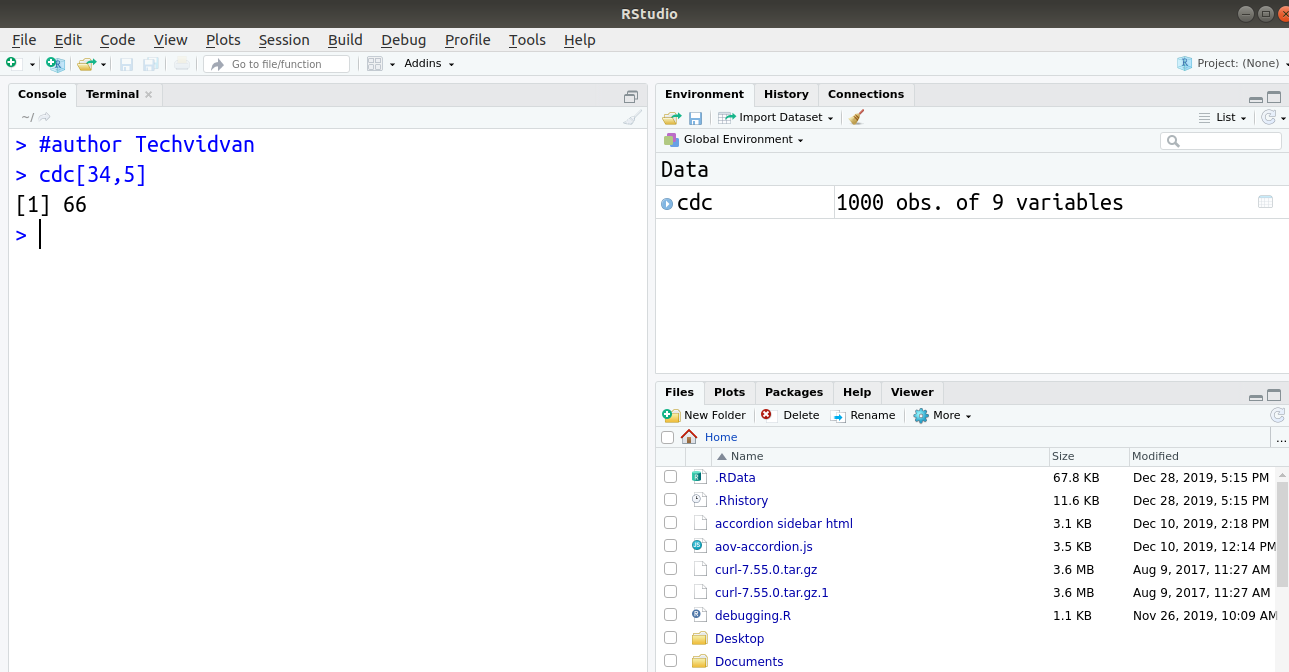
To access a specific element from the dataset
> cdc[34,5]
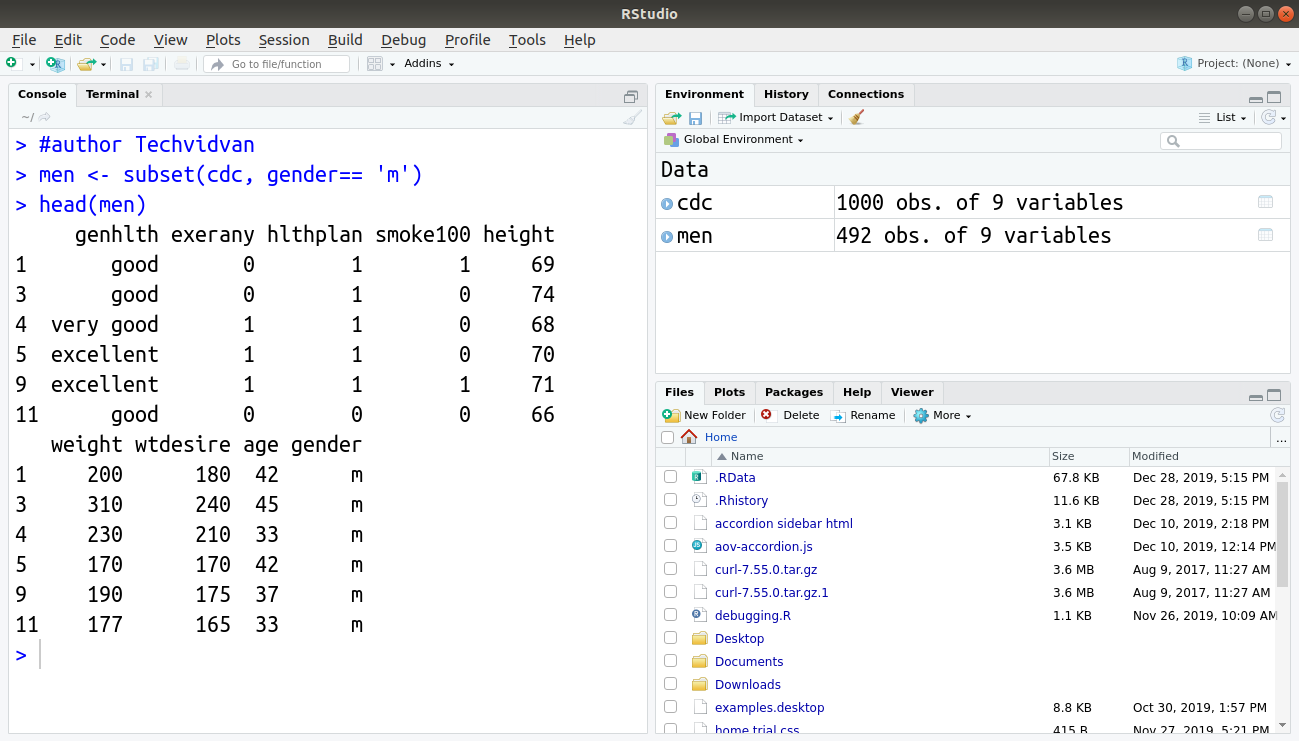
To run a query on the dataset, you can use the subset() function. The function takes two arguments or parameters. The first being the name of the dataset. The second parameter is a condition, the entries satisfying the condition are included in the subset. For eg: a subset where the gender of the person is male or ‘m’.
> men <- subset(cdc, gender== 'm')
3. Basic Statistics
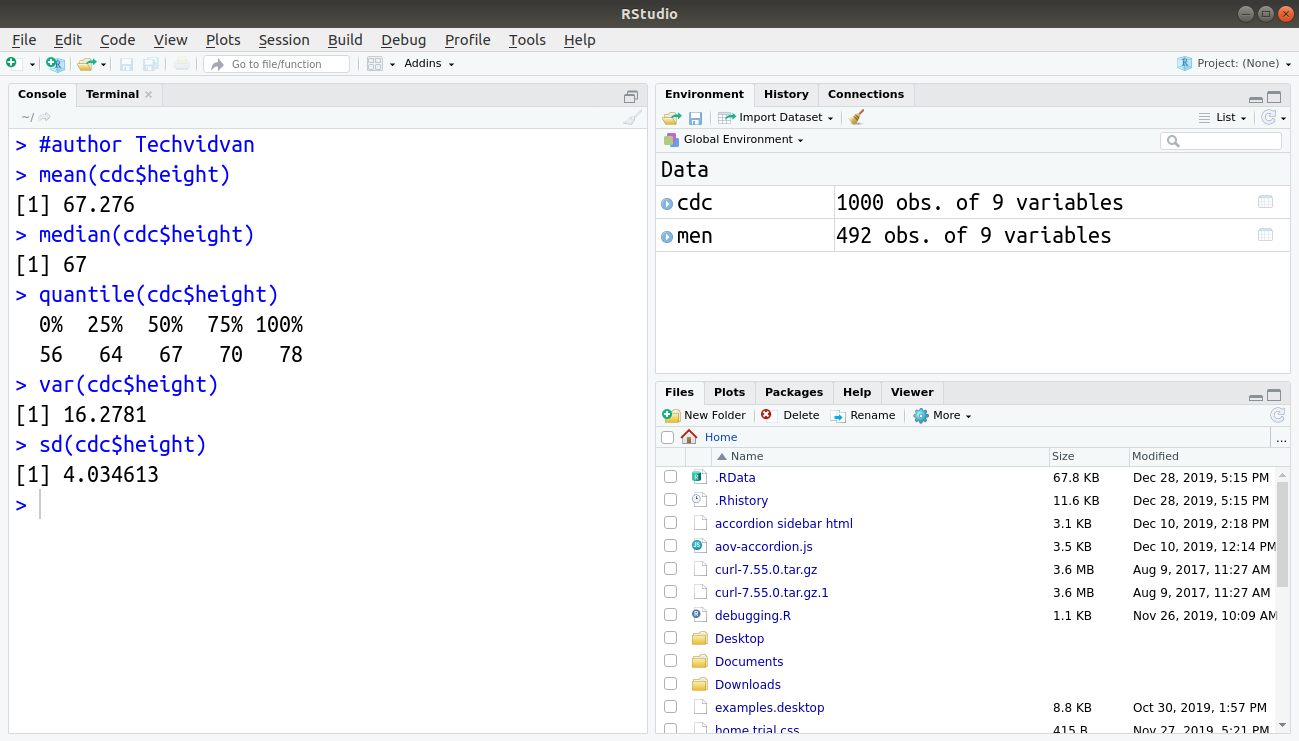
R and RStudio have simple commands for calculating basic statistics and averages. Some of these commands are:
Mean of any column:
> mean(cdc$height)
Median:
> median(cdc$height)
Quantile:
> quantile(cdc$height)
Variance:
> var(cdc$height)
Standard Deviation:
> sd(cdc$height)
4. Plotting Data in RStudio
R has several functions like plot() for plotting the available data. Using one of these functions you can visualize any data in R. For example:
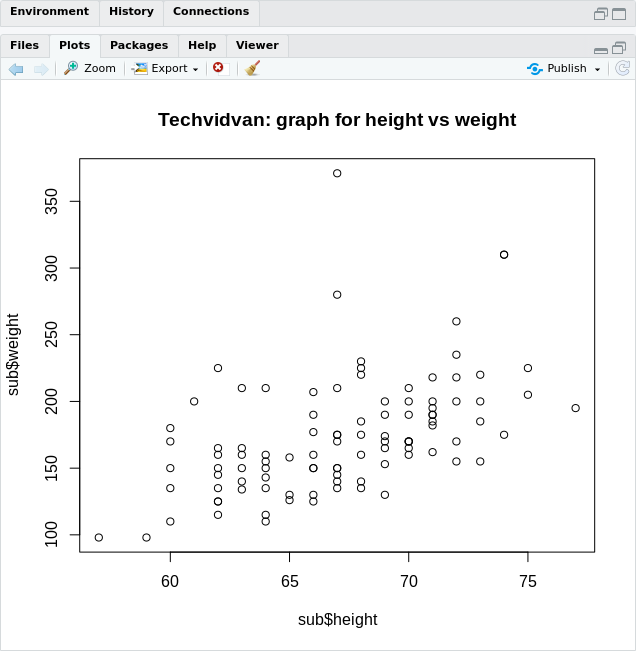
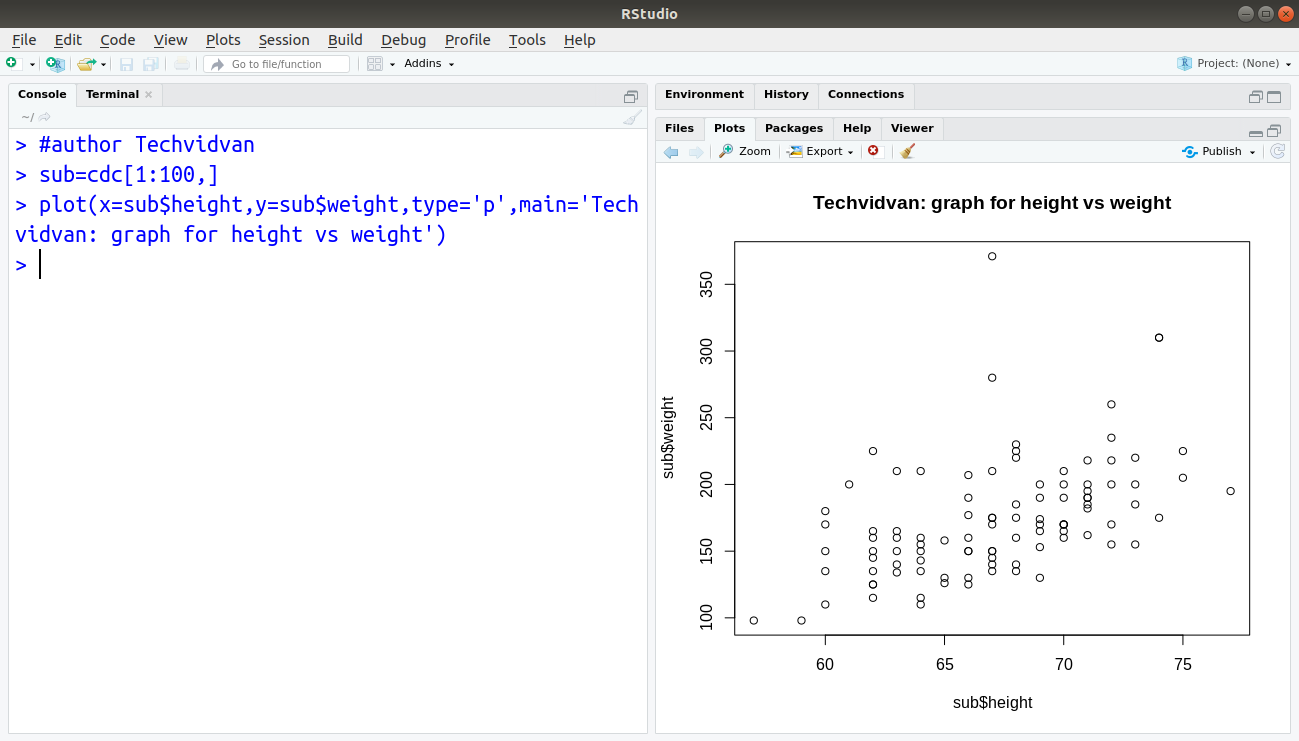
If we want to plot the subset of the first 100 observations of cdc, based on the height and weight of the people. We can use the plot() function like so:
> sub=cdc[1:100,]
> plot(x=sub$height,y=sub$weight,type='p',main='graph for height vs weight')
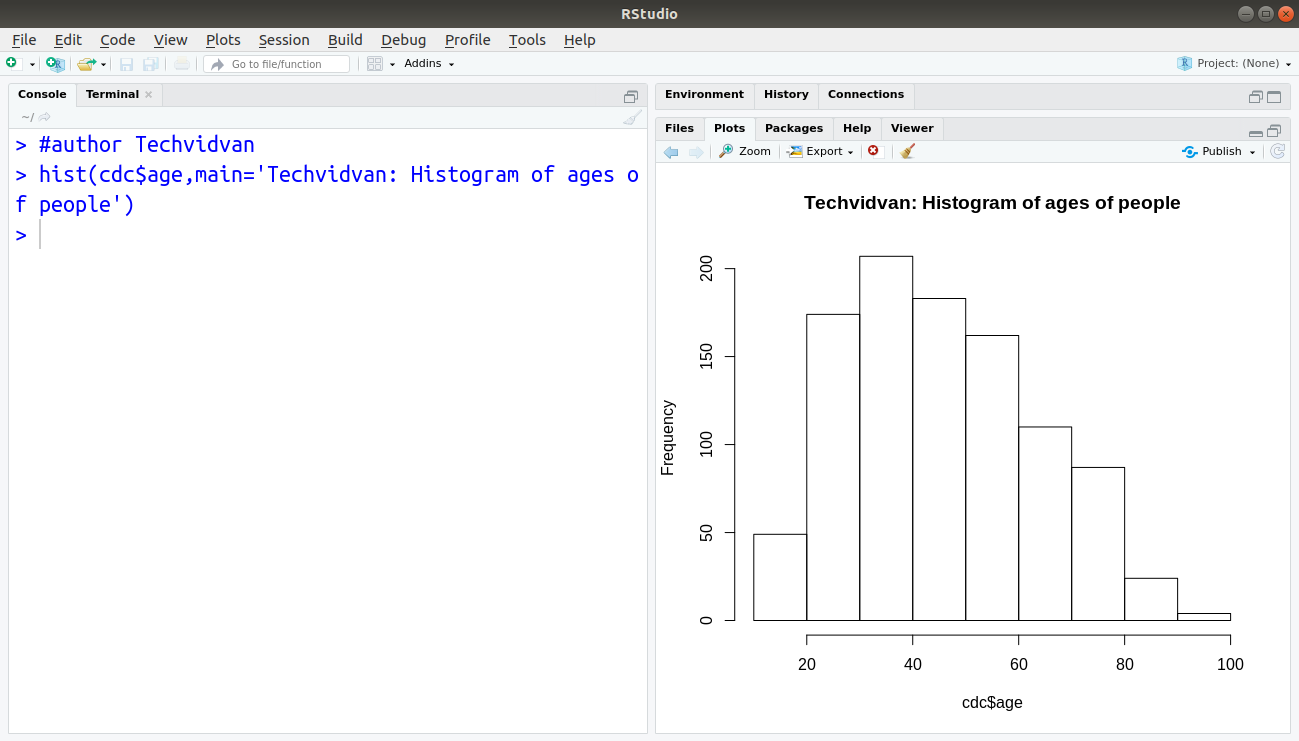
We can also draw a histogram of, let’s say, the ages of the people using the following command.
> hist(cdc$age)
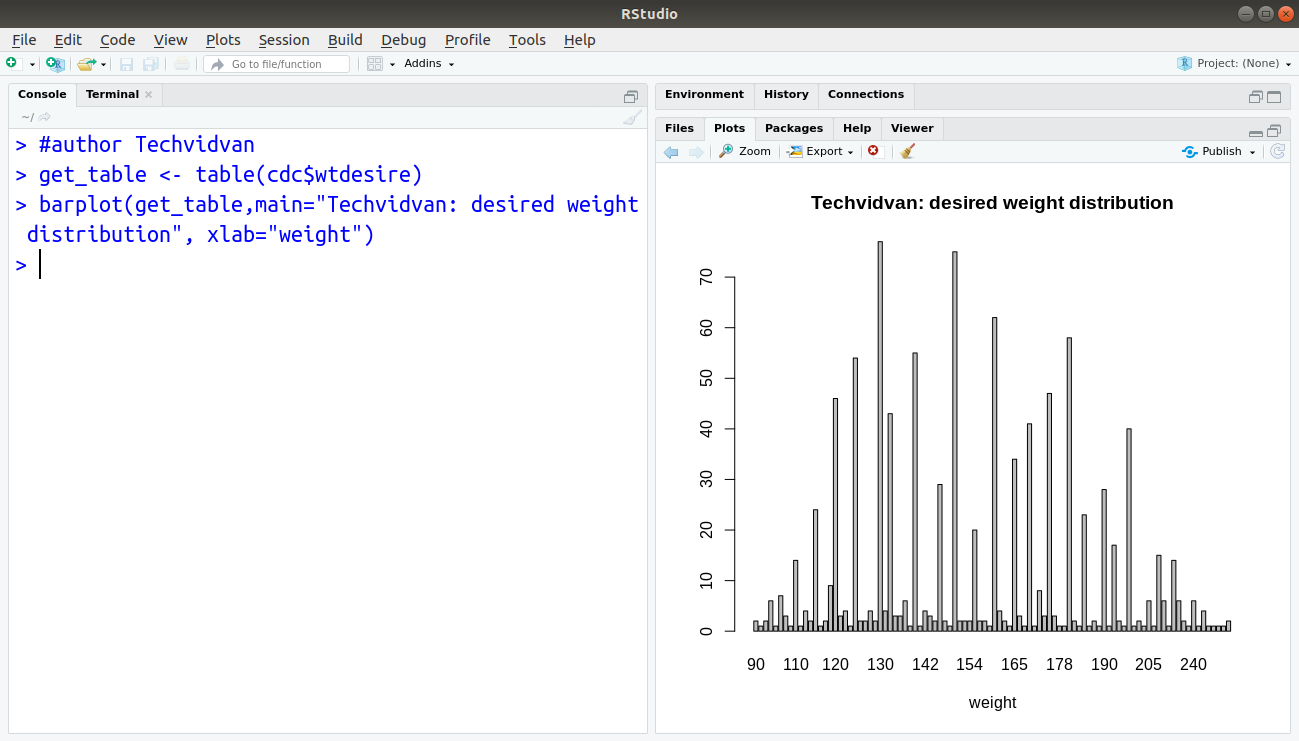
We can make bar charts using the following commands.
> get_table <- table(cdc$wtdesire)
> barplot(get_table,main="desired weight distribution", xlab="weight")
Summary
RStudio is the most popular and easy-to-use IDE for R. In this RStudio tutorial, we went through the layout of the RStudio. We then looked at how to import, transform, analyze and plot data in RStudio. Now you must learn various data types that R can handle.
We hope this RStudio tutorial helped you and now it will be easier for you to use RStudio.
Keep Learning!!