Data Analytics using Python Certification Course with AI & ChatGPT
- Earn Industry-recognized IBM certification
- Build real-time projects with industry-aligned tools
- Live Interactive sessions from industry veterans
- Updated curriculum designed for AI-era
- Boost employability with globally recognized IBM credentials

Numbers That Speak Our Success
Success Stories – They Believed, Learned & Achieved!


Our learners are working in leading organizations
Gain industry-ready skills and earn an official certificate from DataFlair and IBM.


Need Personalized Guidance? Talk Directly to Your Instructor

Online Data Analytics with Python Training Course Curriculum
- Overview of Python
- Why Choose Python for Programming?
- What is Python?
- Real-World Applications of Python
- Platform Dependent vs Independent Languages
- Key Features of Python
- Limitations of Python
- The Evolution and History of Python
- Installing Python
- Installing and Setting Up PyCharm
- Introduction to IDLE
- How Python Code is Executed
- Writing and Running the “Hello World” Program
- Python Statements, Indentation, and Comments
- How to Print in Python
- Getting User Input in Python
- Understanding Methods, Identifiers, and Variables
- Python Data Types and Variables
- Rules for Declaring Identifiers
- Input and Output Functions in Python
- Reading Data in a Single Line
- Using the print() Function
- Formatted Print Statements
- The Replacement Operator
- Printing with the format() Method
- Different Types of Operators in Python
- Bitwise Operators in Python
- Arithmetic and Assignment Operators
- Number System Conversion in Python
- Identity Operators
- Writing if-else Statements in Python
- Using if-elif Conditions
- Creating Pyramid Patterns with Control Statements
- Transfer Statements: Break and Continue
- Using the Pass Statement
- Introduction to Loops
- Types of Loops: while and for
- Using Nested Loops
- What Are Strings?
- Built-in String Functions
- String Class and Methods
- Common String Operations
- Type Casting in Python
- Understanding Collections in Python
- Working with Lists, Tuples, Sets, and Frozen Sets
- Using Dictionaries in Python
- Bytes and Bytearray Collections
- Understanding Functions in Python
- Types of Functions and Methods
- Creating Functions in Python
- Parameters and Arguments
- Function Arguments and Call by Value
- Types of Function Arguments
- Returning Values from Functions
- Passing Functions as Arguments
- Global Variables and the global Keyword
- Using the eval() Function
- Writing Recursive Functions
- Implementing Factorial with Recursion
- Reversing Numbers with Recursion
- Fibonacci Series with Recursion
- Anonymous Functions with lambda
- Using the filter() Function with lambda
- lambda with the map() Function
- Introduction to Arrays
- Arrays Operations
- Types and Concepts of Arrays
- Using Arrays in Python
- Array Methods in Python
- Creating Arrays with NumPy
- Comparing Arrays in Python
- Understanding Object References
- Difference Between View and Copy
- Exploring NumPy Array Dimensions and Attributes
- Working with Multidimensional Arrays
- Using Matrices in Python with NumPy
- Implementing Binary Search
- Writing a Bubble Sort Algorithm
- Procedural vs Object-Oriented Programming
- Key Concepts of OOP in Python
- Creating Classes and Objects
- Understanding the self Variable
- Using the __init__() Method
- Constructor Overloading in Python
- Exploring Polymorphism and Operator Overloading
- Relational Operator Overloading
- Overloading vs Overriding in Python
- Using Getters and Setters
- Static Variables and Methods
- Working with Inner Classes
- Understanding Is-A vs Has-A Relationships
- Implementing Inheritance and Using the super() Method
- Types of Inheritance in Python
- Role of Constructors in Multiple Inheritance
- Abstract Classes and Methods
- Creating Interfaces in Python
- Basics of Exception Handling
- Common Exception Types
- Using try, except, and finally Blocks
- Exception Handling with Practical Programs
- Using the finally Statement
- Working with Assertions
- Raising Exceptions in Python
- Writing Custom Exceptions
- Introduction to Files in Python
- File Modes (r+, w+, a+)
- Reading, Writing, and Appending Files
- Using with for File Handling
- Handling File Exceptions
- Writing Data to a File with Practical Programs
- Working with readlines() and writelines() Methods
- Counting Lines, Words, and Characters in a File
- Reading Files Character by Character
- Binary File Operations in Python
- Working with the Pickle Module
- Reading and Writing CSV Files
- Using tell() and seek() Methods
- Core Concepts of NumPy Arrays
- Creating Arrays in NumPy
- Comparing Arrays in NumPy
- Performing Arithmetic Operations on Arrays
- Data Analysis with Pandas
- Working with DataFrames in Pandas
- Inserting, Deleting, and Updating Data in Pandas DataFrames
- Creating Beautiful Graphs with Matplotlib
- Creating Pie Chart, Bar Graphs, Scatter Plots, Histogram, etc.
- Draw Plot using Seaborn
- Work on Bar, Histogram, Scatter and Heatmap Plots.
- Data Analytics Overview
- Importance of Data Analytics
- Types of Data Analytics
- Benefits of Data Analytics
- Data Visualization for Decision Making
- Descriptive Analytics
- Diagnostic Analytics
- Predictive Analytics
- Prescriptive Analytics
- Strategies for imputing or removing missing values
- Techniques for identifying and treating outliers
- Understanding different data types
- Managing various file formats
- Applying normalization procedures
- Scaling features for consistency
- Combining and harmonizing multiple data sources
- Working with NumPy, Pandas & Matplotlib
- Leveraging Principal Component Analysis (PCA)
- Utilizing Singular Value Decomposition (SVD)
- Selecting the most relevant features
- Computing measures of central tendency and spread
- Creating frequency distribution tables
- Drawing box plots
- Plotting histograms
- Generating scatter plots
- Implementing Ridge and Lasso regression
- Exploring Elastic Net regularization
- Fitting polynomial regression models
- Mining association rules with the Apriori algorithm
- Building recommendation engines via collaborative filtering
- Understand the role of data analytics in supporting business decision-making.
- Differentiate between types of analytics (descriptive, diagnostic, predictive, prescriptive) and their uses.
- Practice framing business problems as data questions and identifying relevant metrics/KPIs.
- Learn how to consider stakeholder needs and context when planning analyses.
- Learn core principles of data ethics (privacy, consent, fairness, transparency, accountability).
- Understand legal and compliance considerations (e.g. data protection regulations) in handling data.
- Recognize common ethical pitfalls (bias, misuse of data) and how to address them.
- Develop strategies to ensure ethical, responsible use of data in projects.
- Apply advanced EDA techniques to uncover patterns, trends, and anomalies in data.
- Utilize data profiling tools to quickly generate summary reports of datasets.
- Learn methods for handling large or complex datasets (sampling, using advanced libraries or workflows).
- Improve skills in visualizing and interpreting data distributions and relationships.
- Exploratory Data Analysis
- Numerical vs Categorical Data
- Continuous vs Discrete Data
- Feature Engineering
- Handling Missing Values
- Handling Outliers
- Univariate, Bivariate, Multivariate Analysis
- Correlation
- Data Cleaning Essentials
- Business Insights from EDA
- Grasp fundamental machine learning concepts (supervised vs. unsupervised learning, overfitting, etc.).
- Learn to apply common ML algorithms for analysis: e.g. regression, classification, clustering.
- Gain practical experience using Python libraries (such as scikit-learn) to train and evaluate simple models.
- Understand how to interpret model results and incorporate predictive insights into business contexts.
- Develop skills to turn analytical findings into a compelling narrative.
- Learn best practices for data visualization in the context of storytelling (choosing the right chart, simplifying complexity).
- Understand how to tailor communication of insights to different audiences (technical vs. non-technical).
- Practice presenting data-driven recommendations clearly and persuasively.
- Apply the full analytics process to real-world data problems from various domains.
- Practice end-to-end project execution: from defining the problem and cleaning data to analysis, modeling, and presenting results.
- Develop problem-solving skills and adaptability when faced with open-ended data challenges.
- Build a portfolio of case study projects to demonstrate skills to employers.
- Understand how to structure and document Jupyter Notebook analyses for reproducibility and sharing.
- Explore methods for deploying or sharing results (e.g. publishing notebooks, creating simple dashboards).
- Familiarise yourself with other workflow tools and best practices that increase productivity and teamwork in data projects.
- NumPy, Pandas, Matplotlib and Scikit-learn Installation in PyCharm
- Price Prediction Application
- Salary Prediction of Employees
- Marks Prediction of Students
- How to Visualize Predicted Value
- Introduction to Regression
- Regression Real-World Use Cases
- Types of Regression Problems
- Linear Regression
- Evaluation Metrics
- Common Challenges with Regression
- Linear vs Polynomial vs Ridge vs Lasso Regression
- Regression Industry Applications
- Insurance Price Prediction
- Salary Prediction
- Home Price Prediction
- Sales Forecasting for a Retail Store
- How to Save Trained Model in File using Pickle
- How to Save Trained Model in File using Joblib
- Dummy Varibales in Dataset
- Jupyter Notebook Installation
- Write ML Algorithm in Jupyter Notebook
- Split Data into Training and Test Data
- What is Logistic Regression
- What is Classification?
- Regression vs. Classification
- Classification Real-World Applications
- Types of Classification Problems
- Data Preparation for Classification
- Label Encoding vs One-Hot Encoding
- Feature Scaling in ML
- Train-Test Split in ML
- Handling Imbalanced Data in Classification
- Model Evaluation Metrics in Classification
- Accuracy in Classification
- Precision, Recall, F1-Score in Classification
- Confusion Matrix in Classification
- ROC Curve and AUC Score in Classification
- Overfitting & Underfitting in ML
- Regularization Techniques in Classification
- Insurance Prediction
- Employee Retention Prediction
- Digits Prediction
- Car Price Prediction
- Loan Prediction
- Loan Approval Classifier
- Suspicious Login Detection
- What is k-NN?
- How k-NN Works
- KNN Distance Metrics
- Choosing the Right ‘k’ in KNN
- Data Preparation for KNN
- Categorical Features Handling in KNN
- Strengths and Limitations of KNN
- Evaluation Metrics in KNN
- KNN Model Tuning
- Cross-Validation in KNN for Optimal ‘k’
- What is Decision Tree?
- Practical Implementation of Decision Tree
- Types of Decision Trees
- Components of a Decision Tree
- Decision Tree Splitting Criteria
- Gini Impurity in Decision Tree
- Entropy & Information Gain in Decision Tree N
- Advantages and Limitations of Decision Tree
- Pre-Pruning and Post-Pruning in Decision Tree
- Decision Tree Evaluation Metrics
- Decision Tree Hyperparameter Tuning
- Decision Tree Cross-Validation
- Iris Flower
- Tennis Game
- Titanic Movie
- College Admission Eligibility Predictor
- Restaurant Preference Classifier
- Flight Booking Cancellation Prediction
- Introduction to Random Forest
- Why use Random Forest over a Single Tree?
- Concepts Behind Random Forest
- How Random Forest Works
- Random Forest Hyperparameters
- Random Forest Advantages and Limitations
- Random Forest Use Cases
- Loan Approval Classifier
- Tourist Destination Recommender
- Credit Card Fraud Detection
- Digits Image Classification
- Iris Flower Prediction
- Differences Between Supervised and Unsupervised Learning
- What is unsupervised learning?
- Supervised vs unsupervised learning
- Where to use Unsupervised learning
- Application of Unsupervised learning
- Popular Algorithms in Unsupervised Learning
- Real world use cases of Unsupervised learning
- Clustering Algorithms
- Classification vs Clustering
- K-means Clustering
- K-means Clustering Real-world industry use cases
- Elbow method in K-means Clustering
- Hierarchical Clustering
- Agglomerative vs Divisive Approach in Hierarchical Clustering
- Hierarchical Clustering Real-world industry use cases
- Evaluation Metrics
- Introduction to Artificial Intelligence
- Working with AI
- Using AI in Data Analytics
- Real-time application of AI
- Usage of AI in Data Analytics
- Differences between traditional AI and Generative AI
- Introduction to Gen AI
- Importance in working with AI models like GPT and DALL·E.
- Gen AI Applications across industries (e.g., BFSI, Retail, Telecom).
- Introduction to Prompt Engineering
- Working with Prompts
- Best Practices of Prompt Design
- Types of prompts
- Components of effective prompts: Clarity, specificity, and relevance.
- Challenges in Prompt Engineering
- Understanding limitations of AI models.
- Ethical considerations in designing and using pro
- Sales Forecasting with Time Series Analysis
- Customer Segmentation
- Customer Churn Prediction
- Market Basket Analysis
- Web Traffic Trend Analysis and Anomaly Detection
- Credit Card Fraud Detection
- Supply Chain Demand Forecasting
- IoT Sensor Anomaly Detection
- Predictive Maintenance for Manufacturing Equipment
- IoT Sensor Data Analytics for Smart Homes
- Introduction to SQL
- SQL Prerequisites
- What is SQL
- Purpose of SQL
- MySQL Server Installation
- SQLYog Installation
- Difference Between DBMS and RDBMS
- SQL Database and Database Server
- Comments in SQL
- What are SQL Commands
- SQL DDL Statements
- SQL DDL Statements – Alter and Drop Command
- Practical Implementation of SQL DDL Command
- SQL DML Statements
- SQL DML Statements – Delete and Update Command
- Practical Implementation of SQL DML Command
- SQL TCL Command
- Practical Implementation of TCL Command
- SQL DCL Command
- Practical Implementation of DCL Command
- What are Data Type in SQL
- String Data Type in SQL
- Numerical Data Type in SQL
- Date Data Type in SQL
- Practical Implementation of Date Data Type in SQL
- What are Operators in SQL
- Arithmetic Operator in SQL
- Relational Operator in SQL
- Logical Operator in SQL
- Practical Implementation of Arithmetic, Relational and Logical Operators
- SQL String Operators
- SQL Like and Not Like Command
- Constraints in SQL
- Practical Implementation of Constraints in SQL
- Order by Clause in SQL
- Practical Implementation of Order by Clause
- GROUP BY and HAVING in SQL
- Practical Implementation of GROUP BY and HAVING in SQL
- Like Command in SQL
- Practical Implementation of Like Command in SQL
- Between and In Command in SQL
- Practical Implementation of Between and In Command
- ANY and ALL Operators
- Alias in SQL
- Practical Implementation of Alias in SQL
- What are Joins in SQL
- Practical Implementation of SQL Joins
- Practical Implementatin of Self Join
- Primary Key and Foreign Key Constraint in SQL
- Practical Implementation of Primary Key and Foreign Key Constraint
- Injection in SQL
- Practical Implementation of Injection
- Null Functions
- Check Constraint in SQL
- Practical Implementation of Check Constraint
- Default Constraint in SQL
- Practical Implementation of Default Constraint
- Null Value in SQL
- Practical Implementations of Null Value in SQL
- Auto Increment in SQL
- Practical Implementation of Auto Increment in SQL
- Aggregate Functions in SQL
- Practical Implementation of Aggregate Functions
- String Functions
- Nested Query in SQL
- Practical Implementation of Nested Query
- SQL Window Function
- Practical Implementation of Window Function
- Bulk Insert in SQL
- Backup and Restore in SQL
- SQL Library Management System Project
- SQL Sales Data Analysis Project
- SQL Restaurant Billing System Project
- SQL Patient Record System Project
- SQL Vehicle Service Booking System Project
- SQL Simple Inventory ans Sales System Project
- SQL Movie Rating System Project
- SQL E-commerce Product Refund and Return Analytics System Project
- What is Business Intelligence
- Stages of Business Intelligence
- Use Cases of BI
- What is Power BI?
- Benefits of using Power BI
- Real-world applications of Power BI
- Various BI Tools
- How to download Power BI Desktop
- Step-by-step installation guide
- Initial setup and configuration
Understanding Power BI components
- Desktop, Service, Mobile
- How these components work together
Power BI Desktop UI
- Introduction to Power BI Desktop
- Installation of Power BI Desktop
- Exploring the Power BI Desktop interface
- Overview of key features and tools
- Navigating through different panes and menus
Identify and Connect to a Data Source
- Types of data sources supported by Power BI
- Choosing the right data source for your needs
Get Data from Flat Files and Relational Data Sources
- Importing data from Excel, CSV, and other flat files
- Connecting to databases like SQL Server, MySQL, and more
Introducing the Power Query Editor and Power Query UI
- What is Power Query?
- Introduction to Power Query Editor
- Navigating the Power Query Editor interface
- Basic features and functionalities
Power Query Ribbon and Different Tabs Introduction
- Overview of the Power Query ribbon
- Understanding different tabs and their functions
Enhance the Structure of the Data and Table Structure
- Organizing and structuring your data tables
- Creating relationships between tables
Profile the Data
- Analyzing data quality
- Identifying and handling data issues
Evaluate and Transform Column Data Types
- Changing data types for accuracy
- Ensuring consistency across your data
Change Data Source Settings
- Updating and managing data source connections
- Handling data source changes efficiently
Identify Fact and Dimension Tables
- Understanding the difference between fact and dimension tables
- Organizing your data for better analysis
Define Relationships and Cardinality
- Creating relationships between tables
- Understanding one-to-many and many-to-many relationships
Design a Data Model Using a Star Schema
- Building a star schema for efficient data analysis
- Benefits of using a star schema in Power BI
Data Modelling and DAX
- Introduction to Relationships
- Creating Relationships
- Cardinality
- Cross-filter direction
- Use of inactive relationships
Introduction of DAX
- Why is DAX used?
- DAX syntax
- DAX functions
- Context in DAX
- Measures using DAX
Create Calculated Tables
- Adding new tables using DAX
- Practical examples of calculated tables
- Learning about table, information, logical, text, iterator,
- Time intelligence functions (YTD, QTD, MTD)
Create Calculated Columns
- Creating columns with custom calculations
- Using DAX for dynamic data manipulation
Create Basic Measures Using DAX
- Understanding measures in Power BI
- Writing simple DAX formulas for calculations
- Date and time functions
Difference Between Calculated Columns and Measures
- When to use calculated columns vs. measures
- Best practices for using DAX in your data model
- DAX advanced features
Create Report from Raw Data
- Starting your first Power BI report
- Importing and organizing your data in reports
Add Visualization Items to Reports
- Inserting charts, graphs, and other visuals
- Customizing visual elements for clarity
Choose an Appropriate Visualization Type
- Selecting the right visual for your data
- Understanding different visualization options
Formatting and Configuring Power BI Charts
- Enhancing the look and feel of your charts
- Using formatting tools effectively
Use a Custom Visual and Import Custom Visuals
- Exploring the Power BI marketplace for custom visuals
- How to import and use custom visuals in your reports
Apply and Customize Themes
- Changing the overall theme of your report
- Creating a consistent look and feel
Configure Conditional Formatting
- Highlighting important data points
- Using color rules to emphasize trends
Apply Sorting
- Sorting data to improve readability
- Techniques for effective data sorting
Apply Slicing and Filtering
- Adding slicers for interactive filtering
- Using filters to focus on specific data
Create Hierarchies
- Building data hierarchies for better navigation
- Using hierarchies to drill down into data
Drilldown/Drillup into Data Using Interactive Visuals
- Exploring data at different levels of detail
- Making your visuals interactive and dynamic
AI Visuals – Q & A, Key Influencers, Decomposition Tree, Smart Narratives
- Utilizing AI-powered visuals for deeper insights
- How to implement and use AI visuals in your reports
Publish Reports
- Sharing your reports with others
- Publishing reports to the Power BI service
Create and Configure a Workspace
- Setting up workspaces for collaboration
- Organizing your projects within workspaces
Assign Workspace Roles
- Managing user roles and permissions
- Ensuring secure access to your data
Configure and Update a Workspace App
- Creating apps for easy access to reports and dashboards
- Updating and maintaining workspace apps
Create Dashboard
- Building your first Power BI dashboard
- Adding and arranging visuals on the dashboard
Manage Tiles on a Dashboard
- Customizing tiles for better presentation
- Organizing tiles for optimal layout
Pin a Live Report Page to a Dashboard
- Linking live report data to your dashboard
- Ensuring real-time data updates on your dashboa
- Introduction to GenAI and its integration with Power BI
- Using Power BI Copilot for report generation and data analysis
- Enhancing dashboards with AI-generated summaries and insights
- Automating data storytelling with natural language narratives
- Real-world use cases of GenAI in business intelligence
- Best practices for using GenAI features responsibly
- Introduction to Interface
- Navigating Sheets and Workbooks
- Ribbon in Excel
- Entering and Editing Data
- Basic Formatting: Fonts, Alignment, Number Formats
- Working with Cell Ranges and Selections
- Saving, Sharing and Collaborating
- Understanding Formulas: Operators and Cell References
- Basic Functions: SUM, AVERAGE, COUNT
- Working with Dates and Times
- Introduction to Logical Functions: IF, AND, OR
- Common Text Functions: CONCATENATE, LEFT, RIGHT, MID
- More on Functions: MIN, MAX, MEDIAN
- Array Formulas Basics
- Error Handling in Formulas
- ISNA and IFERROR Function
- Advanced Sheet Operations
- Jumping Between Sheets
- Mastering Multiple Workbooks
- Hiding and Unhiding Rows and Columns
- Freezing Panes and Splitting Screens
- Conditional Formatting: Highlighting Data
- Creating and Applying Cell Styles
- Working with Tables
- Sorting and Filtering Data
- Charts and Graphs: Creating Visualizations
- Customizing Charts: Formatting and Design
- Sparklines: Visual Data in Cells
- Sorting and Filtering Data: Advanced Techniques
- Working with Pivot Tables: Creating Interactive Reports
- Pivot Charts: Visualizing Pivot Table Data
- What-If Analysis: Goal Seek
- Data Tools in Excel
- Data Validation: Ensuring Data Integrity
- Importing and Exporting Data (CSV, Excel, etc.)
- Lookup Functions: VLOOKUP, INDEX, MATCH, XLOOKUP
- Statistical Functions: COUNTIFS, SUMIFS, AVERAGEIFS, STDEVIFS
- Array Formulas: Working with Ranges of Data
- Financial Functions: PMT, NPV, IRR, FV, PV
- Advanced Text Functions: LEN, PROPER, TRIM, FIND, SEARCH
- Working with Dates and Times (Advanced)
- Advanced Logical Functions
- Introduction to Power Query and Data Import
- Data Cleaning and Transformation
- Adding Columns and Combining Data
- Power Query Automation and Web Scraping
- Loading Data and Best Practices
- Power Pivot in Excel
- Introduction to Excel Automation and Macros
- Getting Started with the VBA Editor (Interface)
- VBA Fundamentals: Variables, Data Types
- Working with Objects: Ranges, Worksheets, and Workbooks
- Automating Tasks & User Interaction
- Debugging, Error Handling, & Macro Security
- Analyze Data Feature: Generating Insights and Visualizations
- Ideas Feature: Formula Suggestions, Data Patterns
- Data from Picture: Extracting Data from Images
- Forecasting with Forecast Sheet: Predicting Future Trends
- Keyboard Shortcuts and Productivity Tips
- Optimizing Performance for Large Datasets
- Planning and Designing Dashboards
- Using PivotTables and PivotCharts for Dynamic Data
- Slicers and Timelines for Interactive Filtering
- Creating Interactive Form Controls
Tools & Technologies


Data Analytics using Python Projects
-
Sales Forecasting with Time Series Analysis
 Predict future sales trends to support business planning and inventory management.Customer Segmentation
 Group customers based on their behavior to improve marketing strategies and product targeting.Customer Churn Prediction
 Identify customers likely to stop using a service to implement effective retention strategies.
 -
Market Basket Analysis
 Discover purchasing patterns to recommend relevant products and increase sales opportunities.Sentiment Analysis
 Analyze customer feedback to understand public opinion and improve brand perception.Web Traffic Trend Analysis and Anomaly Detection
 Analyze website logs to detect unusual traffic spikes or drops using seasonal decomposition
 -
Credit Card Fraud Detection
 Detect suspicious transactions to minimize financial losses and enhance transaction security.Supply Chain Demand Forecasting
 Predict product demand accurately to optimize inventory levels and reduce stockouts.E-commerce Recommender System
 Suggest personalized products to customers to improve shopping experience and boost sales.
 -
IoT Sensor Anomaly Detection
 Monitor sensor data to identify unusual patterns and prevent potential system failures.Predictive Maintenance for Manufacturing Equipment
 Anticipate equipment failures in advance to reduce downtime and maintenance costs.IoT Sensor Data Analytics for Smart Homes
 Analyze smart home device data to optimize energy usage and improve living comfort.
Learn From Industry’s Best Instructors


From Learning to Placement – Enroll in our Live Data Analytics using Python Mastery Batch
Join 1,87,950+ learners enrolled in our Data Analytics using Python Course – Try before you Buy
Benefits:
- ✓ Live Classes with Expert Mentors
- ✓ Practical-based learning
- ✓ Hands-on Projects & Case Studies
- ✓ Dedicated Job Assistance & Resume Building
- ✓ Lifetime Course Access
Benefits:
- ✓ Everything in Live Online Course, plus:
- ✓ Earn Global IBM certificates
- ✓ Professional-level training from IBM
- ✓ Masterclasses from IBM experts
- ✓ IBM-aligned labs for job-ready output
Enroll in Self-paced Data Analytics using Python Course
Key Features:
- ✓ Self-paced Expert-led Course
- ✓ Practical-based Curriculum
- ✓ Full Notes + Study Material
- ✓ Real-world Practicals
- ✓ Assessments to Test Skills
- ✓ Interview Ques of Top MNCs
- ✓ Real-time Live Projects
- ✓ Beginner to Advanced
- ✓ 3 years Access Duration
- ✓ Professional Certificate
Key Features:
- ✓ Everything in “PLUS” plus:
- ✓ Job-Ready Skill Training
- ✓ Live Industry Case Studies
- ✓ 1:1 Expert Counselling
- ✓ Dedicated Job Assistance
- ✓ Resume & Interview Prep
- ✓ Additional live Projects
- ✓ Latest Tools/Tech Covered
- ✓ Lifetime Course Access
- ✓ Learn with ChatGPT & AI
Key Features:
- ✓ Everything in “PRO” plus:
- ✓ Global Certification from IBM
- ✓ IBM-aligned curriculum
- ✓ Industry-grade projects
- ✓ Company-wise Interview Ques
- ✓ Pro-level training from IBM
- ✓ Additional Real-time Projects
- ✓ IBM-aligned labs, job-ready output
- ✓ Masterclasses from IBM experts
- ✓ Enhanced Career Opportunities


Data Analytics with Python Course Objectives
By the end of this Data Analytics with Python course, you will:
- Master the Basics of Python for Data Analysis: Learn Python from scratch, focusing on its powerful libraries like NumPy and Pandas, which are essential for data manipulation and analysis.
- Explore Data with Pandas: Discover how to clean, transform, and explore data sets using Pandas. You’ll be able to handle large datasets efficiently and extract meaningful insights.
- Visualize Data with Matplotlib and Power BI: Learn to create professional data visualizations with Matplotlib in Python and Power BI to present your data clearly, and visually appealingly.
- Introduction to Machine Learning with Scikit-learn: Get an introduction to machine learning, using Scikit-learn to apply algorithms and start making predictions with your data.
- Hands-On Projects: Work on real-world data analytics projects that will give you practical experience and prepare you for the challenges you’ll face as a Data Analyst.
- Boost Your Career: Gain the skills employers are looking for and prepare for a career in data analytics with Python, one of the most in-demand fields today.
Through a mix of theory, practice, and projects, this course will give you the tools to thrive in data analytics. Ready to get started? Let’s dive into the data!
Why should you learn Data Analytics with Python?
- Python is easy to learn and use, even for beginners.
- High demand for data analysts across various industries.
- Python has powerful libraries like NumPy, Pandas, and Matplotlib.
- Data Analytics helps make data-driven decisions.
- Opens career opportunities in finance, healthcare, marketing, and more.
- Python is versatile – you can analyse data, create models, and visualise results.
- Demand for Python in data science is skyrocketing.
- Offers a hands-on approach to understanding data.
- Python is widely used in automation and machine learning.
- Boosts your problem-solving and critical-thinking skills.
- It’s highly customisable to suit various industries and needs.
- It makes working with big data and complex datasets easier.
What is Data Analytics with Python?
The only way to unlock this data is through Data Analytics with Python. With its easy-to-use syntax and robust libraries, Python allows anyone — even non-programmers — to gain insights from data quickly. Whether you want to analyse business trends, make data-driven decisions, or find hidden patterns, you’ll need Python.
Today, data is everywhere. Over 2.5 quintillion bytes of data are created each day in the world. But here’s the challenge: how do you understand it all? That’s where Data Analytics comes in.
Using Python’s libraries like NumPy, Pandas, and Matplotlib, you can clean, manipulate, and visualise data in ways that reveal patterns and trends you never knew existed. The simplicity of Python’s data analysis approach gives a new user a good head-start into efficiently analyzing data. This opportunity can carve out a path in any number of careers in fields as diverse as healthcare, finance and e-commerce.
And when working with numbers with Python, you don’t just work with them – you animate them. You’ll learn how to create and run clickable charts and models speak louder than words so that you can make better decisions quicker. Ready to turn data into insights? Join the course and start your data journey today!
What to do before you begin?
This Data Analytics with Python course is designed for beginners, so no prior programming experience is required. However, having a basic understanding of the following will help you make the most of this course:
- Basic Computer Skills: Familiarity with computer use and navigating software like Excel or web browsers.
- Basic Mathematics: A basic understanding of concepts like averages, percentages, and basic statistics (mean, median, mode) will be helpful.
- Curiosity and Problem-Solving Skills: A keen interest in data and a logical mindset to solve real-world problems using data.
- Familiarity with Excel: While not mandatory, knowing how to work with Excel will give you a head start when learning data manipulation techniques.
The Data Analytics with Python course will teach you everything you need to know, from Python basics to advanced data analysis techniques, step by step.
Who should go for this Data Analytics with Python course?
This Data Analytics with Python course is open to anyone curious about data and eager to build a career in the booming field of data analysis! Whether you’re a student, working professional, or complete beginner, this course is designed to meet your needs.
Here’s Who Will Benefit the Most:
- Students: Engineering or non-engineering or fresh graduate students looking to learn in-demand skills and aiming for high-paying roles in data analysis.
- Working Professionals: Professionals in non-technical roles (like marketing, finance, or HR) who want to add data skills to their portfolio. Those looking to shift into data analytics or related fields without programming experience.
- Complete Beginners: No technical or coding background? No problem! This course teaches everything from scratch.
- Entrepreneurs & Business Owners: Want to make data-driven decisions for your business? Learn how to analyze and visualize data to uncover growth opportunities.
- Career Switchers: If you’re considering a career shift, data analysis is a future-proof choice with versatile applications across industries.
By enrolling in our Data Analytics with Python course, you can expect the following benefits:
- High-Demand Skills, Zero Coding Background Required: Gain hands-on expertise in tools like Python, SQL, Excel, and Power BI, used by top companies worldwide.
- Practical, Job-Ready Training: Work on real-world datasets and solve practical problems faced by finance, healthcare, and e-commerce industries.
- Career-Boosting Opportunities: Data analysts are among the most in-demand professionals, with salaries starting at ₹6-8 LPA in India and $70,000+ globally.
- Learn Industry-Standard Tools and Techniques: Master tools like NumPy, Pandas, Matplotlib, and Scikit-learn, and create interactive dashboards with Power BI.
- Versatility Across Industries: Data analysis skills are needed in almost every field, from entertainment (Netflix recommendations) to finance (fraud detection) and healthcare (predictive patient care).
- Personalized for Beginners: Our step-by-step approach ensures you build confidence and expertise.
- Build a Solid Foundation for the Future: Data analysis is the gateway to fields like Data Science, Artificial Intelligence, and Machine Learning. Lay the groundwork to transition into these advanced domains if you expand your expertise.
- Empower Decision-Making Skills: Whether you’re a student, professional, or entrepreneur, these skills will amplify your decision-making capabilities.
- Flexible Learning at Your Own Pace: The self-paced nature of this course ensures that you can learn at a speed comfortable for you without overwhelming schedules.
Jobs after Learning this Data Analytics with Python Course
Mastering data analysis opens the door to many high-demand, well-paying job roles across industries. Here are the top career paths you can pursue after completing this course:
1. Data Analyst
- Role: Transform raw data into actionable insights for businesses.
- Average Salary: ₹6-8 LPA (India), $70,000+ (International).
- Industries: E-commerce, finance, healthcare, and more.
2. Business Analyst
- Role: Bridge the gap between business goals and technical solutions by analyzing data and improving processes.
- Average Salary: ₹7-10 LPA (India), $75,000+ (International).
- Industries: Banking, IT, and consulting.
3. Reporting Analyst
- Role: Create dynamic dashboards and visualizations to help businesses track KPIs and performance.
- Tools Used: Power BI, Excel, SQL.
- Average Salary: ₹5-7 LPA (India), $65,000+ (International).
4. SQL Developer
- Role: Design, manage, and analyze databases using SQL.
- Average Salary: ₹6-9 LPA (India), $72,000+ (International).
- Industries: Tech, telecom, and retail.
5. Data Visualization Specialist
- Role: Create impactful visual dashboards and presentations to communicate complex data insights.
- Tools Used: Power BI, Matplotlib, Excel.
- Average Salary: ₹5-8 LPA (India), $70,000+ (International).
6. Market Research Analyst
- Role: Analyze market trends, consumer behavior, and competition to guide business strategies.
- Average Salary: ₹4-6 LPA (India), $60,000+ (International).
7. Operations Analyst
- Role: Use data to optimize processes and improve operational efficiency.
- Industries: Logistics, supply chain, and manufacturing.
8. Financial Analyst
- Role: Analyze financial data, forecast trends, and assist in decision-making for investments and budgeting.
- Average Salary: ₹7-10 LPA (India), $75,000+ (International).
9. Product Analyst
- Role: Evaluate product performance and user behavior to improve customer experience and guide product development.
- Industries: Technology, SaaS, and startups.
10. Entry Point to Advanced Roles
This course lays the foundation for transitioning into high-level roles such as:
- Data Scientist
- Machine Learning Engineer
- AI Specialist
Our students are working in leading organizations
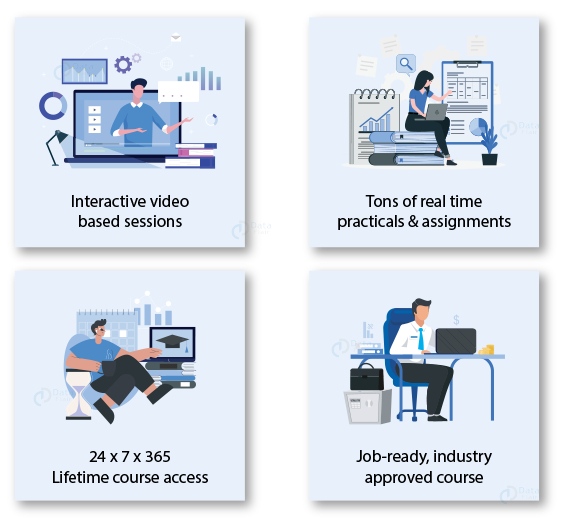
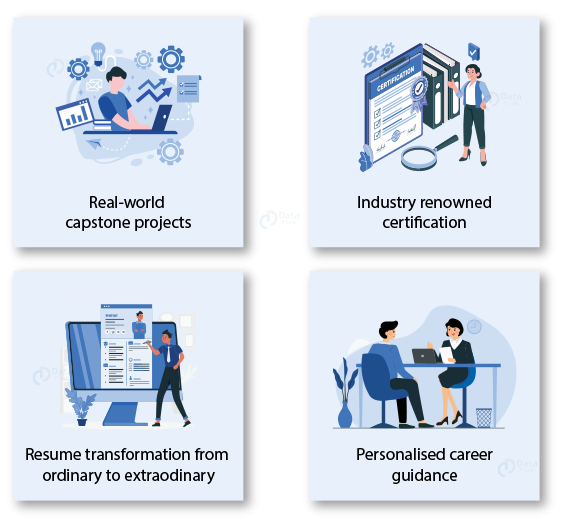
Features of Data Analytics with Python Course
Looking for Industry Expert Counselling?
We are a team of trainers who have 20+ years of Industry Experience. They provide project based training and cover real time scenarios during the interactive training sessions.
Contact our Industry Experts & get answers to all your queries.
Data Analytics with Python Online Training FAQs
Data Analytics involves inspecting, cleaning, and modeling data to discover useful information, support decision-making, and uncover trends.
Data Analytics is a highly demanded career with opportunities in multiple industries, such as finance, healthcare, marketing, and technology.
Key skills include data cleaning, data visualization, statistical analysis, and proficiency in tools like Excel, SQL, and Python.
No! With Python, learning Data Analytics becomes accessible even for non-programmers, using simple syntax and powerful libraries.
Depending on your pace, it can take a few months to a year to become proficient in the basics of Data Analytics.
Data Analytics focuses on analyzing and interpreting data, while Data Science includes advanced modeling, machine learning, and deeper statistical techniques.
Yes, with the increasing importance of data in decision-making, the demand for skilled Data Analysts is growing rapidly across industries.
Career growth can lead to roles like Data Scientist, Business Analyst, Data Engineer, and Chief Data Officer (CDO).
Common challenges include cleaning messy data, handling large datasets, and understandably presenting complex findings.
Salaries vary by location and experience, but a Data Analyst’s salary can range from $50,000 to $100,000 annually in many countries.
