K-Means Clustering in Machine Learning
In this article, we will specifically focus on one of the popular algorithms of clustering i.e., K-means clustering. This is one of the most used clustering algorithms.
Here, we will mainly look at how the algorithm works, what are its benefits and shortcomings. We will discuss its various areas of usage. So, let’s begin.
What is K-means Clustering?
The algorithm that we will now dive into comes under unsupervised learning. Here, we deal with data that isn’t labelled and unsupervised learning generally, uses input vectors to draw information from the datasets.
Well, the premise of the k-means clustering is that it divides the dataset into similar and non-similar data and it clusters them.
Let’s say, if there are two different varieties of data in a dataset, then we will have two clusters. Here, ‘k’ is a fixed value. The number we equate ‘k’ with, is the number of clusters the algorithm will form. Also, in mathematics, there is a concept known as vector quantization.
K-means clustering is a part of this concept. Also, the K-means algorithm is a part of the much bigger Expectation-Maximization algorithm.
We have another technique known as the elbow point technique used for determining the value of k. We will study about it in this article.
Note:- The second meaning of K is that it is a hyper-parameter. A hyper-parameter is a variable whose value we set before the training phase of the algorithm.
Well, it’s always better to understand with a real-life example.
If we have a dataset of let’s say, junk-food eaters and healthy food eaters, the value of k here will be 2. Since we have two clusters that can form over here. We have shown it graphically in x-y axes terms as well. This way we can also find categories of data like only junk-food eaters, only healthy-food eaters.
Also, varying categories like junk-food eaters who also consume healthy food and vice versa. The numbers can vary, but that’s exactly the aim here.
To understand various hidden patterns in the data. If we can picture these:
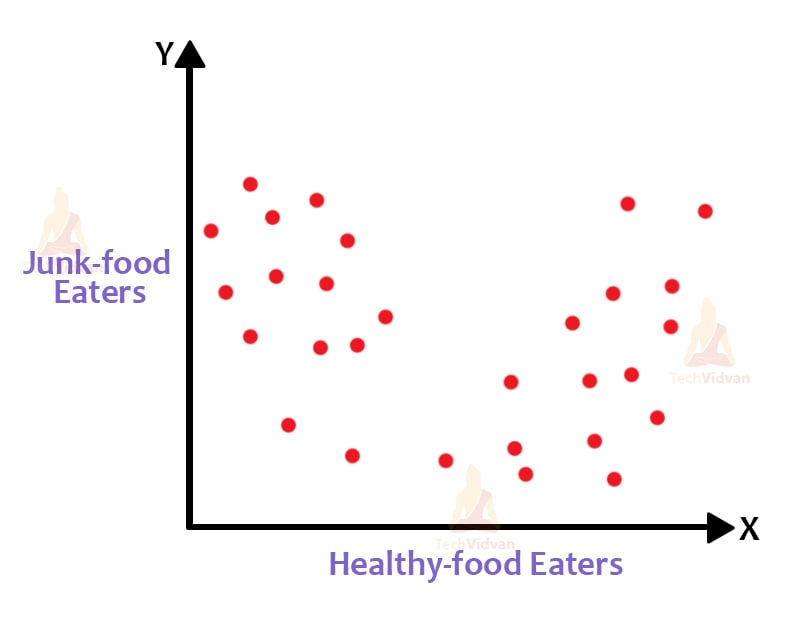
This plot shows the distribution of the data. This has numerous combinations of data available in it. Now, let’s see how the cluster forms.
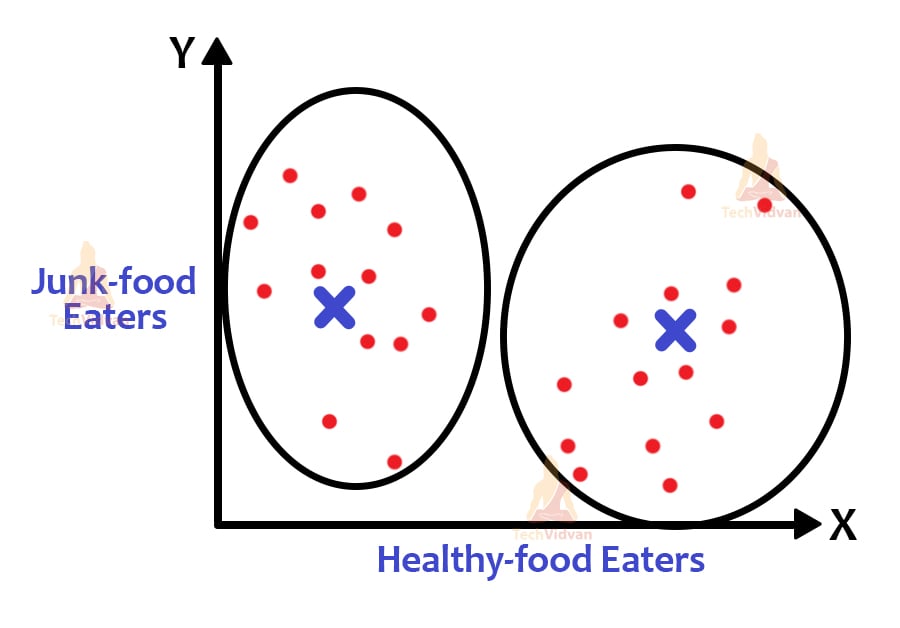
The cross-marks are the centroids of the clusters. The algorithm here identifies the centroids of the clusters. Centroids can be both imaginary and real if taken, but the main aim is to find the centroids and to cluster data around them.
How does K-means clustering work?
Well, here let’s try to understand how exactly this algorithm works. Let’s see a basic explanation first and then dive into the deeper concepts.
- Everything begins with the value of ‘k’. The preset value will give the algorithm a start on how many clusters should it form.
- At first, the algorithm allocates the number of clusters (let’s say k=2 for now). These are just random points for now and are not central.

These two above points are just random.
- The algorithm will now calculate the distance between the centroid and the points.
- Remember that the distance for one point will be calculated for both the centroids.
- The point will join that centroid that has a lesser distance from it.
- After the points are now separated by the criteria of distance compared with the clusters, the visualization would look like this:
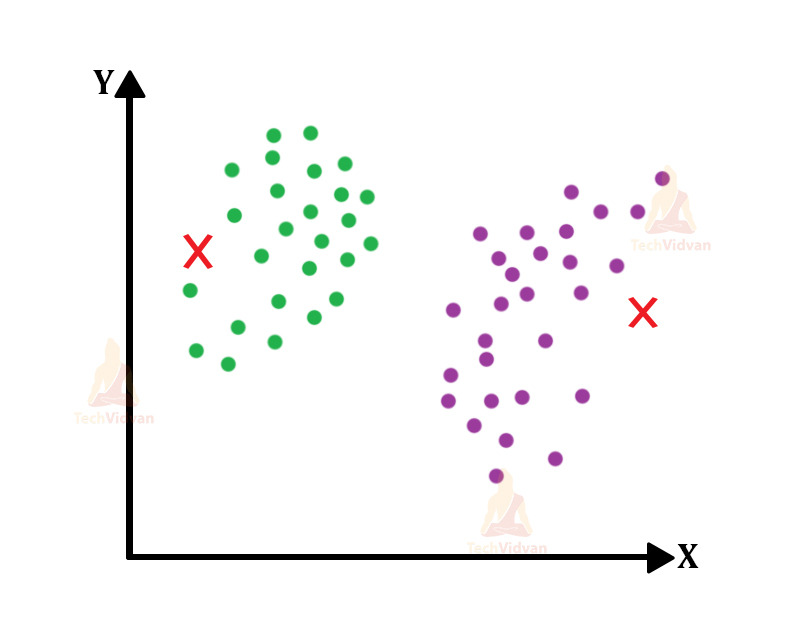
We have the points well arranged around their respective clusters.
- Now, since the centroids were just random points at first, now they need to position themselves in a certain manner in which they behave like actual centroids.
- For this, the algorithm will have to reposition the locations of the centroids by again calculating the distances with the points and forming a well-balanced structure.
- The centroids will now look something like this, shown in the image below.
- Notice that with each iteration, the centroid calculates the distance between itself and the points and slowly maneuvers its way into a much more stable position.
- The images are still but it is just to show how the centroids shift their positions.

Compare the previous image with this one. If you look carefully, the centroids have now shifted.
- The distance calculation and repositioning of centroids and cluster will take place until we receive a stable structure.
- The entire process starting from the distance comparison up to the readjusting of clusters everything is an iterative process.
- If the final product is an unstable structure, it would again start from the distance calculation phase.
- When we achieve stability, this would mean that the clusters have formed and have stable centroids now.
- Also, we have some stopping criteria for the k-means clustering algorithm.
- The stopping criteria are very essential to determine if the result has been achieved or to stop the algorithm. These are:
- Centroids have stabilized and do not require a change in their value. This means that the clusters have become stable too.
- The points in one cluster remain in the same even after many iterations. This means that they are now part of a stable cluster. If they move to another cluster, this would mean instability.
- The last one is if the number of iterations is completed. We can pre-set the number of iterations as let’s say 50 or 100 (any number). If it’s completed then the program stops.
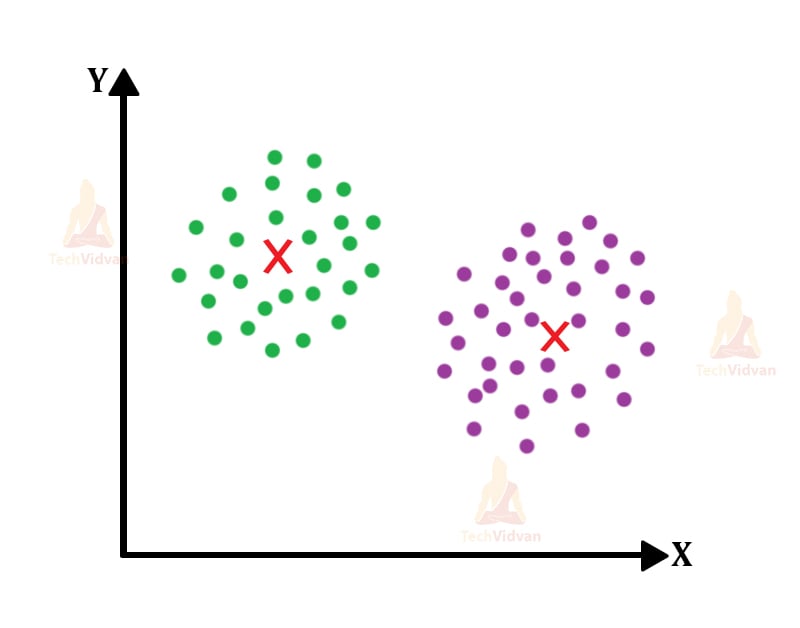
The final stable version would look something like this. Now that we have seen the explanation for this basic concept, let us now dive deeper. Let’s try to understand some side concepts that are necessary to know.
Special Properties of Clusters in Machine Learning
1. Inertia
Inertia is the intra-cluster distance that we calculate. The measurement of the inertia is very significant in the formation of a cluster because it will help us to improve the stability of the cluster. The closer the points are to the centroid area, the better and the cluster will be much more stable.
So, the conclusion is that the distance between the points within a cluster must be minimum for the cluster to be stable. So, the value of inertia should also be less.
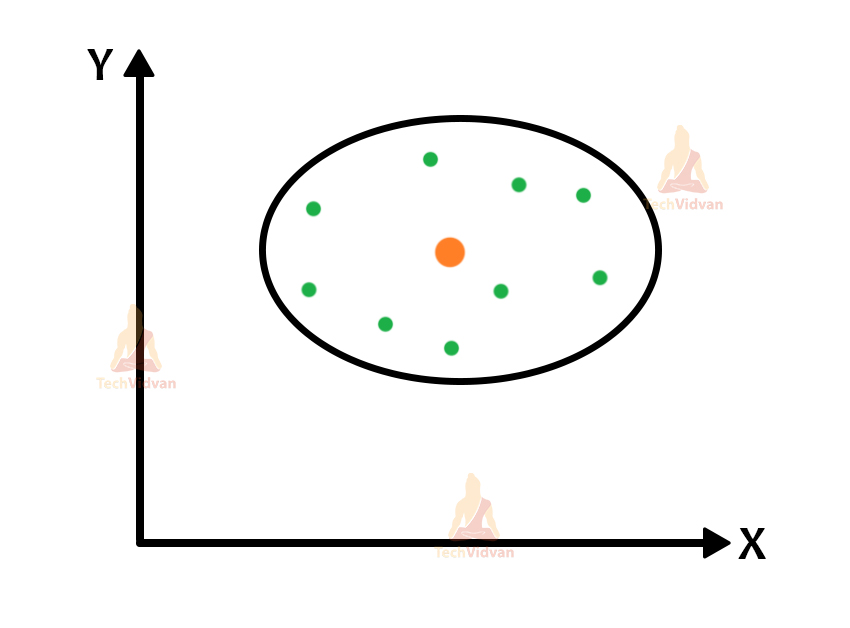
Here, we calculate the intra-cluster distance that is the sum of the distance of all the individual points with the centroid of the cluster. The centroid is the red point and the rest all are the green points.
2. Dunn Index in Machine Learning
We all saw that inertia is about the points within the cluster. But what about the nearby clusters? Even though inertia could help in creating stable clusters but it doesn’t work on separating two different clusters.
This is where the Dunn index comes into play. Dunn index makes sure both of these aspects are properly followed to achieve a stable cluster.
Dunn Index = (minimum distance between two clusters)/(maximum distance of points within the cluster)
So basically, this is the distance between two clusters divided by inertia.
The key point to note here is that the Dunn index should be as high as possible for the clusters to be stable. The inertia has to be minimum and the inter-cluster distance has to be high.

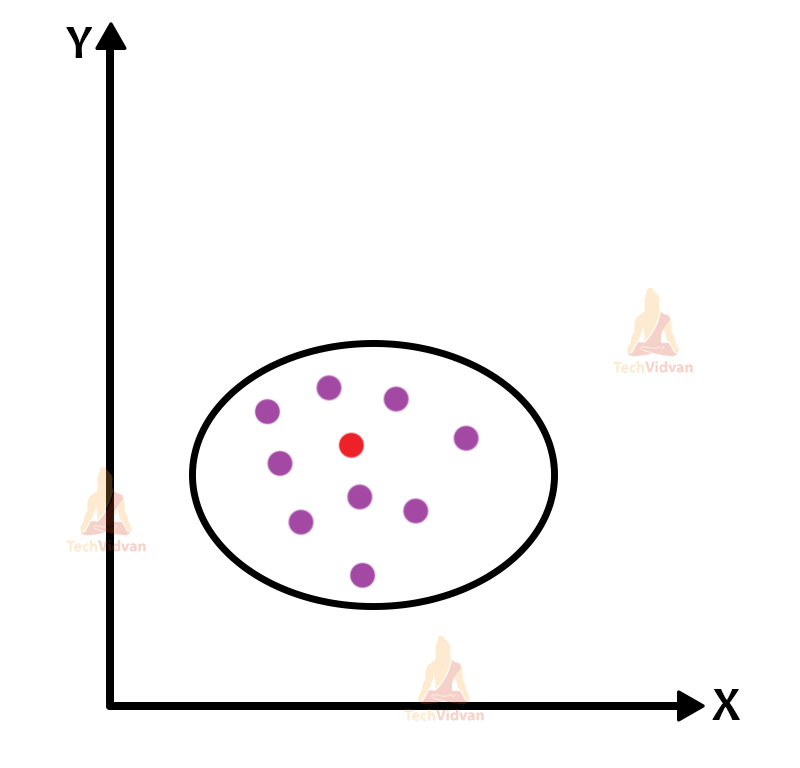
Here, we calculate the inter-cluster distance that is the distance between the two centroids of the clusters. We also calculate the intra-cluster distance here as the Dunn index makes sure both are followed to ensure a stable cluster.
Distance Metrics in Machine Learning
This mathematical concept helps us to measure the distance between the centroids and the data points. We have several types of distance calculation methods.
But, for k-means clustering, we will look at four specific types.
1. Euclidean distance: We use this method to measure the distance between two integer or floating points (real-valued points).
We calculate this distance over a straight line as it is the square root of the summation of the square of distances. To put it in simpler terms, let’s see the formula.
d = √(∑(B-A)2
Here, the summation is from i= 1 to n. Also, B and A are the points.
- Squared Euclidean distance: This distance is just like the normal Euclidean except for the square-root.
d = ∑(B-A)2
2. Manhattan distance: The Manhattan distance is the sum of the difference between the coordinates of the points. We can say that it is the sum of the vertical and the horizontal components.
Also, we can say that it is the distance between the points that we measure along the axes ( at 90 degrees).
d = |A1 – B1| + |A2 – B2|
This is the case for two points. But, for an m number of points, we have a generalized version.
d = ∑|Ai – Bi|
This is also from i=1 to m.
3. Minkowski distance: We use this as the generalization between both Euclidean and Manhattan distances. This formula can handle m number of points and at the same time, it’s also multi-dimensional.
d = (∑|Ai – Bi|P)1/P
Here, p is the order.
Well, so now, let’s discuss another version of k-means clustering but this time we will be finding the value of k using a new technique known as the Elbow point technique.
Elbow-Point Technique in Machine Learning
This technique is a very calculative way to find the optimal (best) value of k. For a long time, we have used the normal method of assigning the value of k beforehand that is just a trial and error type of technique. But, here we calculate the value of k via a graph plot.
Once, we get the value of ‘k’, the procedure is quite similar to the first technique. So, here, for each value of ‘k’, the algorithm gives, that many clusters will form.
Let’s say if k=1 then 1 cluster will form. For k=2, 2 clusters will form, and so on.
Now, the main concept is that we have to calculate the square of the summation of the intra-cluster distance.
Let’s say that if in a cluster, we have 10 points, then it goes like the square of the distance between these individual points and the centroid and then the summation of all these is the result we need. The result has another name here known as the cost (Squared-sum error).
For each value of ‘k’, we observe the distortion or deviation of the graph. For, more value of ‘k’ we would have more centroids and lesser the cost.
So, the point where the graph takes a sharp or significant change in direction will be the elbow point. This value of elbow point will be our optimal value of ‘k’.
The sum of squared distance here means the distance between the data point and the point that is the nearest to the centroid (or centroid as assumed in many places).
S = ∑(Xi-Ci)2
Here, the summation is from i=1 to m. To understand it better, let’s see how the cost vs value of the ‘k’ graph looks like.
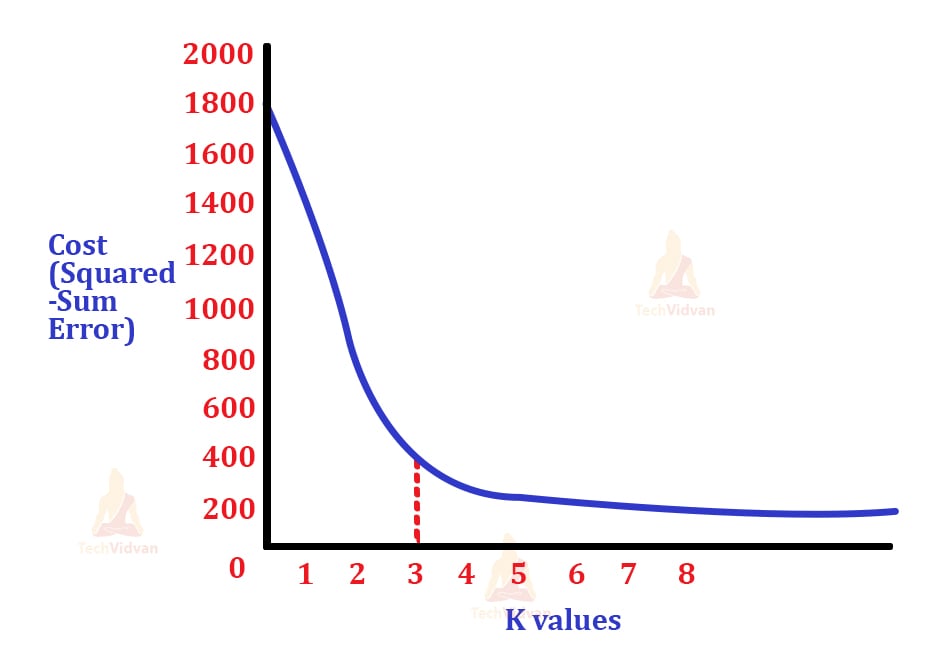
After finding this value of ‘k’, the rest of the clustering procedure is the same.
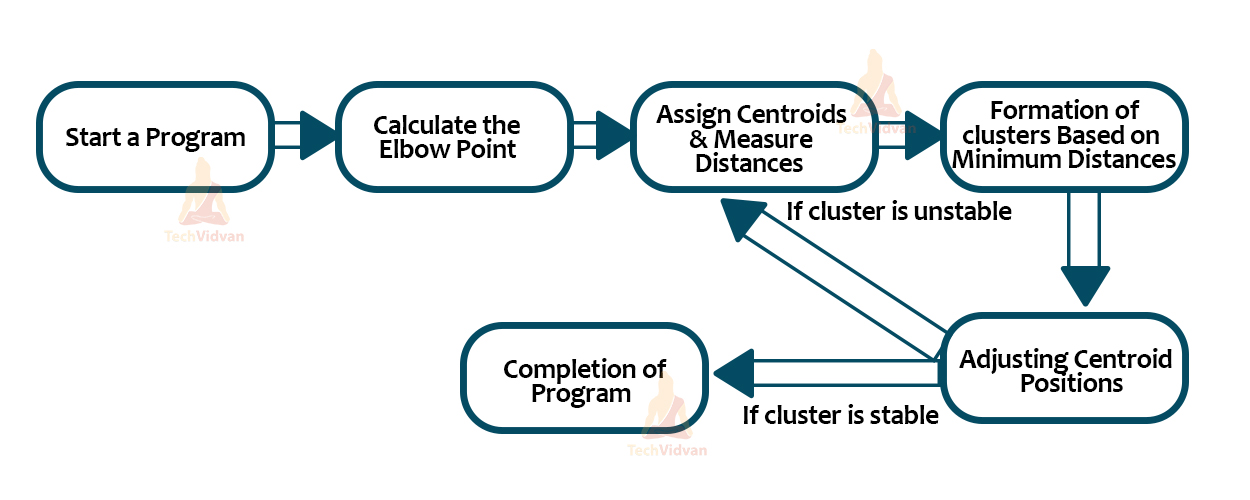
The above image is a brief explanation of how the procedure follows when the elbow point technique comes into play.
Advantages of K-means Clustering in ML
- It works well with large datasets and it’s very easy to implement.
- In clustering, especially in K-means, we have the benefit of having a convergence stage in the final as it’s a good indicator of stable clusters. The program stops when the best result comes out.
- We can use numerous examples as data in it. It is a very adaptive type of algorithm.
- It can create clusters of a variety of shapes that gives much broader importance to the data visualization part.
- The clusters of k-means do not overlap with each other as they prove to be non-hierarchical.
- K-means is faster than hierarchical clustering.
- The clusters produced can be a lot dense and tighter than hierarchical clustering due to the presence of globular clusters.
Disadvantages of K-means Clustering in machine Learning
- We need to choose the value of ‘k’ by ourselves. Or we can use a longer method like the elbow point method. But, it would still take time.
- It’s hard to cluster for varying density and size.
- Outliers can cause problems for the position of the centroid. If an outlier is in the cluster, it would alter the centroid position
- This isn’t suitable for a non-convex shaped cluster.
K-Means Clustering Applications
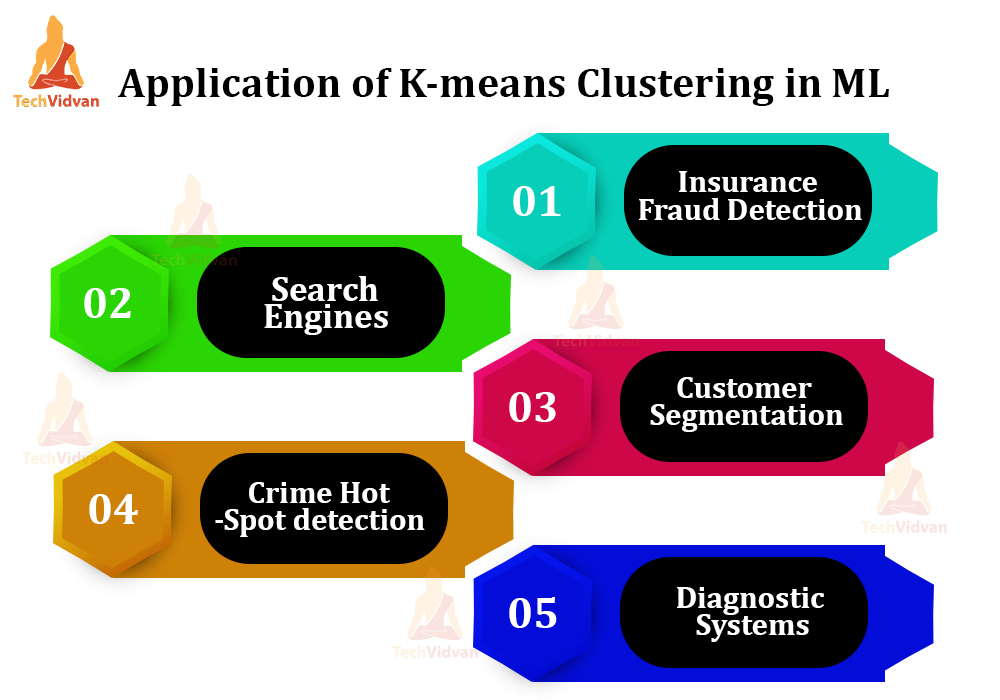
We have various interesting areas of application of K-means Clustering.
1. Insurance Fraud Detection
We make use of past data and also we draw various patterns to make sure that if any new case comes, it would definitely incline towards any specific cluster that the algorithms have created. It’s an important thing to do as it can really help us to reduce insurance fraud.
2. Search Engines
The algorithm helps to form various clusters of possible results. If any search happens using the search engine, the result will be from a particular cluster, as search engines have a huge collection of clusters.
The query would incline to a particular one prompting the algorithm to give out the accurate result.
3. Customer Segmentation
Companies find this very beneficial for improving their customer base. They would generally create various clusters of types of customers and would specifically target a few of them to improve their campaign.
4. Crime Hot-Spot Detection
This is a useful one for any city’s police department. Using this model, they would identify specific areas with a high frequency of crimes and can gain a lot of information from this.
5. Diagnostic Systems
In the medical profession, professionals deal with various cases of ailments, both severe and normal. This clustering algorithm can help them in various ways like, detect ailments by taking in data of symptoms. They can also help in being smart support systems and help in making better decisions.
Conclusion
So, we had an in-depth discussion in the middle section, where we saw the working of the k-means clustering algorithm. We learned some new stuff like the elbow point technique that were newer ways to calculate ‘k’. This article was also about understanding the inner concepts of the algorithm.
We also looked at some pros and cons of k-means. And finally, tried to wrap the topic with some diverse applications that we can learn about.