Bar Chart in R – Implementation, Customization and Example
Bar chart in R is one of the most popular and commonly used graph in the history of graphical representation and data visualization. They represent different measures as rectangular bars, with the height(in case of vertical graphs) and width(in case of horizontal graphs) representing the magnitudes of their corresponding measures.
In this R tutorial, we are going to study bar charts in detail. We will look at the theory behind them, how to implement them in R and how to customize them. We will also look at how to plot them using the ggplot2 package. So, without any further ado, let’s get started.

Bar charts in R
A bar chart is a kind of graph that is usually used to compare different categories. It represents every category as a rectangular bar, with the height/width of the rectangle along the opposite axis representing the frequency of the category. Bar charts can also represent data with complex categories as stacked bar charts.
Making Bar charts in R
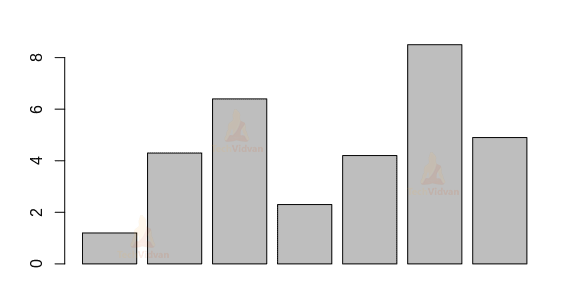
Making bar charts in R is quite simple. We can make them using the barplot() command.
barplot(c(1.2,4.3,6.4,2.3,4.2,8.5,4.9))
Output:
Customizing Bar Charts in R
1. Adding a name to the chart
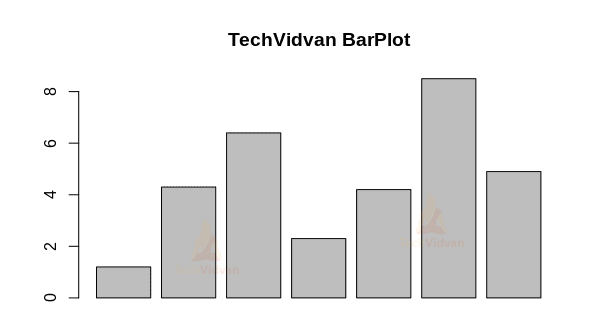
It is possible to add a title to the graph by using the main argument.
barplot(c(1.2,4.3,6.4,2.3,4.2,8.5,4.9),
        main="TechVidvan BarPlot")
Output:
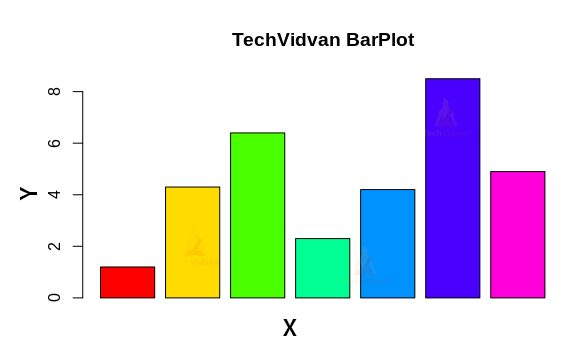
2. Adding labels to the bar chart
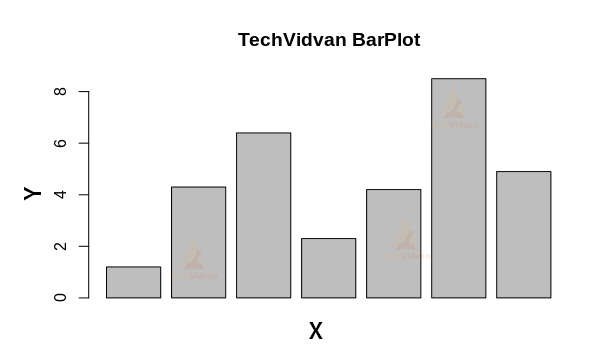
Using the xlab and the ylab arguments, we can add labels to the X and Y axes of the bar chart.
barplot(c(1.2,4.3,6.4,2.3,4.2,8.5,4.9),
        main="TechVidvan BarPlot",
        xlab="X",
        ylab="Y")
Output
3. Changing the color of the bars
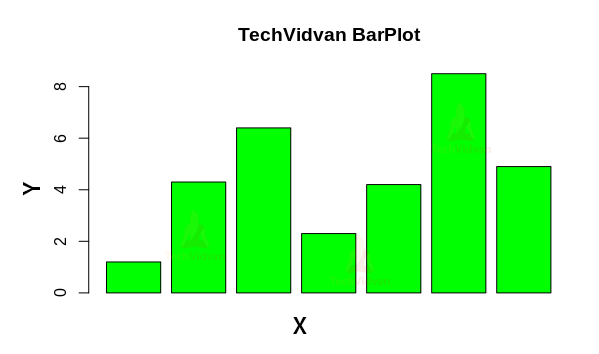
We can use the col argument to change the color of the bars.
barplot(c(1.2,4.3,6.4,2.3,4.2,8.5,4.9),
        main="TechVidvan BarPlot",
        xlab="X",
        ylab="Y",
        col="green")
Output:
barplot(c(1.2,4.3,6.4,2.3,4.2,8.5,4.9),
        main="TechVidvan BarPlot",
        xlab="X",
        ylab="Y",
        col=rainbow(7))
4. Adding a border to the bars
Using the border argument, a border can be added to the bars inside the plot
barplot(c(1.2,4.3,6.4,2.3,4.2,8.5,4.9),
        main="TechVidvan BarPlot",
        xlab="X",
        ylab="Y",
        col=rainbow(7),
        border="red")

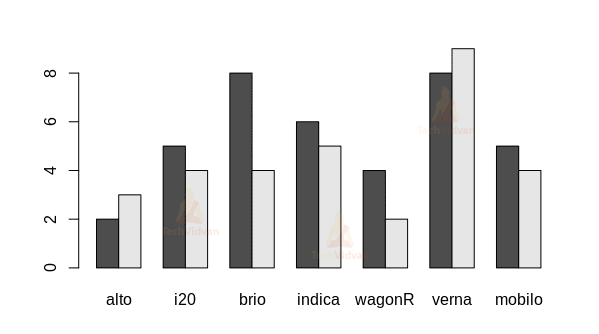
Grouped Bar Plots in R
In case, we need to show a comparison between groups of repeating variables. For example, imagine a shop that rents and sells cars. We need to compare how many rentals and sales does each model of car has. We can use a group bar plot for such a situation. To create a grouped barplot the input data needs to be in the form of a matrix and the beside argument should be set to TRUE.
colnames <- c("alto","i20","brio","indica","wagonR","verna","mobilo")
rowname <- c("rental","sales")
carsmat <- matrix(c(2,3,5,4,8,4,6,5,4,2,8,9,5,4),
                  c(2,7),
                  byrow=FALSE)
colnames(carsmat) <- colnames
rownames(carsmat) <- rowname
barplot(carsmat,beside=TRUE)
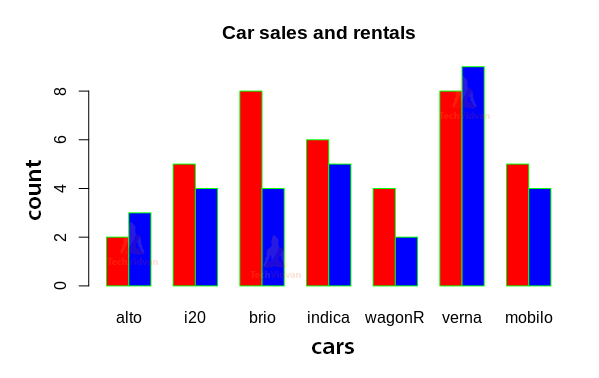
Customizing the grouped barplot in R
Using the arguments of the barplot() function, we can customize the graph the way we want.
barplot(carsmat,
        beside=TRUE,
        main="Car sales and rentals",
        xlab = "cars",
        ylabs = "count",
        col=c("red","blue"),
        border="green")
Output
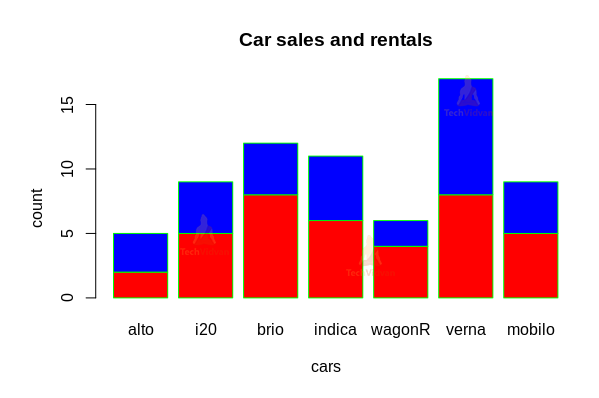
Stacked bar plots in R
Stacked bar plots have a similar purpose to the group bar plots. The only difference between the two is the arrangement of the bars. Unlike the grouped barplot, the stacked barplot does not have the bars arranged side-by-side. Instead, in stacked bar plots, the bars are stacked on top of each other. By default, the barplot function creates a stacked barplot if the input data is a matrix.
barplot(carsmat)
Output

Customizing the R stacked barplot
Stacked bar plots can be customized similarly to normal other bar plots.
barplot(carsmat,
        main="Car sales and rentals",
        xlab = "cars",
        ylabs = "count",
        col=c("red","blue"),
        border="green")
Output
Barplots Using the Ggplot2 Package
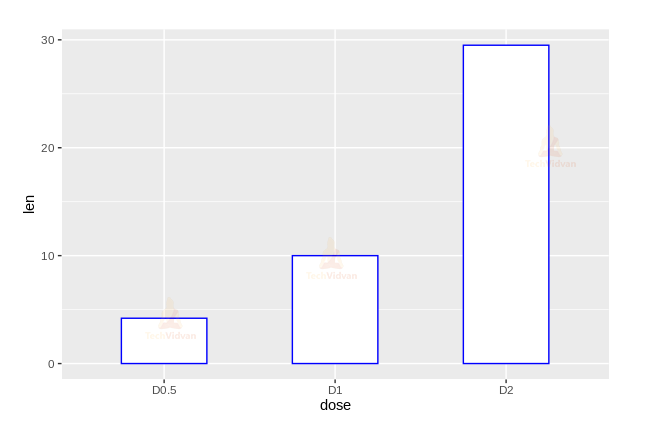
Ggplot2 is probably the best graphics and visualization package available in R. It is highly versatile and gives a large variety of customizability. In this section of the bar plots in R tutorial, we are going to take see how to make bar plots in R using the ggplot2 package.
library(ggplot2)
df <- data.frame(dose=c("D0.5", "D1", "D2"),
                 len=c(4.2, 10, 29.5))
ggplot(df, aes(x=dose, y=len)) +
  geom_bar(stat="identity",
           width=0.5,
           color="blue",
           fill="white") +
  geom_text(aes(label=len),
            vjust=1.6,
            color="white",
            size=3.5)
Summary
In this chapter of TechVidvan’s R tutorial series, we learned all about bar chart in R. We studied the theory behind it. Then, we looked at how to make and customize it in R. Finally, we learned how to make bar plots in R using the ggplot2 package.
Do follow us on facebook to get more articles on latest technologies.