Learn R Programming
R Tutorials Unlock the latest R tutorials and learn R Programming from scratch Introduction to R Features of R Pros and Cons of R Why R? R Applications Career in R Install R R...
![]()
R Tutorials Unlock the latest R tutorials and learn R Programming from scratch Introduction to R Features of R Pros and Cons of R Why R? R Applications Career in R Install R R...

In this article of the TechVidvan’s R tutorial series, we are going to learn about Support Vector Machines or SVM’s. We will study the SVM algorithm. We shall then look into its advantages and...
In this R tutorial, we are going to talk about hypothesis testing in R. We will start off with what is hypothesis testing? We shall, then, move on to decision errors and T-tests. Next,...
In the generalized linear models tutorial, we learned about various GLM’s like linear regression, logistic regression, etc.. In this tutorial of the TechVidvan’s R tutorial series, we are going to look at linear regression...
In this R tutorial, we are going to study logistic regression in R programming. We will learn what is R logistic regression. We will also look at the theory and procedure of logistic regression....
In the previous R tutorial, we learned about linear regression and how to implement it in R. With this chapter of TechVidvan’s R tutorial series, we are going to study non-linear regression in R....

In this article, we are going to study decision trees in R programming and their implementation. We will learn what are R decision trees. We shall also look at how to create them and...

Previously in TechVidvan’s R tutorial series, we learned about decision trees and how to implement them in R. We saw how it is a classification and regression technique and has quite a lot of...
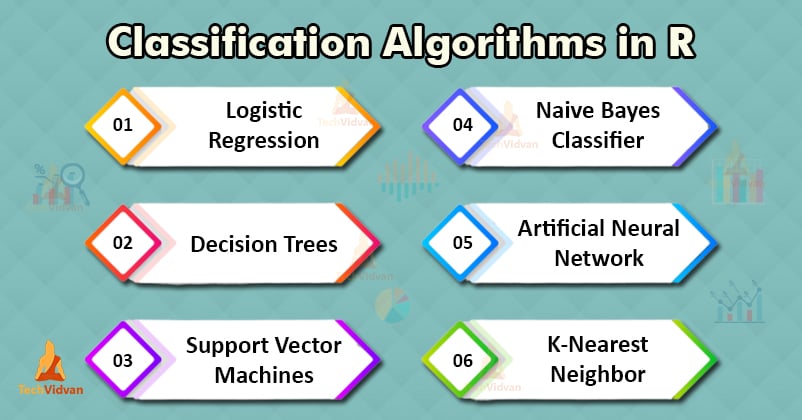
In this R tutorial, we are going to learn about R Classification and various classification techniques and algorithms in machine learning and R. We will start off with what is classification in R? We...
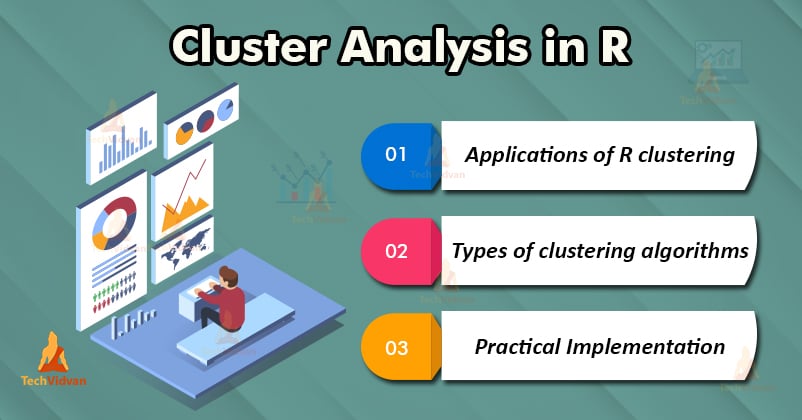
Welcome back to Techvidvan’s R Tutorial series. In this article, we are going to learn a very important machine learning technique called clustering. We will study what is cluster analysis in R and what...