Cluster Analysis in R – Complete Guide on Clustering in R
Welcome back to Techvidvan’s R Tutorial series. In this article, we are going to learn a very important machine learning technique called clustering. We will study what is cluster analysis in R and what are its uses. Then we will look at the different R clustering algorithms in detail. Finally, we will implement clustering in R.
Cluster Analysis in R
Clustering is one of the most popular and commonly used classification techniques used in machine learning. In clustering or cluster analysis in R, we attempt to group objects with similar traits and features together, such that a larger set of objects is divided into smaller sets of objects. The objects in a subset are more similar to other objects in that set than to objects in other sets.
Clustering is not an algorithm, rather it is a way of solving classification problems. There are multiple algorithms that solve classification problems by using the clustering method. These algorithms differ in their efficiency, their approach to sorting objects into the various clusters, and even their definition of a cluster.
Imagine you have a dataset containing n rows and m columns and that we need to classify the objects in the dataset. We can see this dataset as n points in an m dimensional space. In a clustering algorithm, we calculate the distance between these objects and put the objects nearest to each other into separate clusters.
Applications of Clustering in R
There are many classification-problems in every aspect of our lives today. Machine learning helps to solve most of them. One of the multitudes of clustering algorithms helps to solve these problems. Let us look at a few of the real-life problems that are solved using clustering.
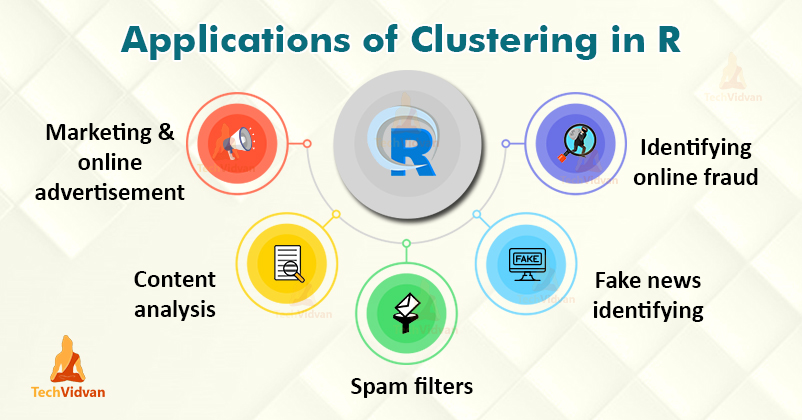
1. Marketing and online advertisement
Identifying customers that are more likely to respond to your product and its marketing is a very common classification problem these days. Everybody is online these days. This also poses a problem as not everybody is going to be receptive to a marketing campaign. Clustering algorithms are used to classify various customers according to their interests which helps with targeted marketing.
2. Content analysis
Clustering algorithms are used to classify content based on various factors like key terms, sources, and subjects. Many search engines and custom search services use clustering algorithms to classify documents and content according to their categories and search terms.
3. Fake news identifying
The internet is full of fake news and advice. These fake facts are not only misleading they can also be dangerous for many people. Clustering algorithms are helpful to match news, facts, and advice with verified sources and classify them as truths, half-truths, and lies.
4. Spam filters
Spam filters are classic examples of classification models. They classify emails and messages as important and spam, based on the content inside them. They used the sender address, key terms inside the message and other factors to identify which message is spam and which is not.
5. Identifying online fraud
Clustering algorithms are also used to identify suspicious transactions and purchases. This helps in identifying and stopping incidents of online fraudulent and thievery. They are also used to classify credit card transactions as authentic or suspicious in an effort to identify credit card fraud.
Types of R Clustering Algorithms
There are more than 100 clustering algorithms available and they all differ in many different aspects from each other. Classifying these classification algorithms isn’t easy but they can be broadly divided into four categories.
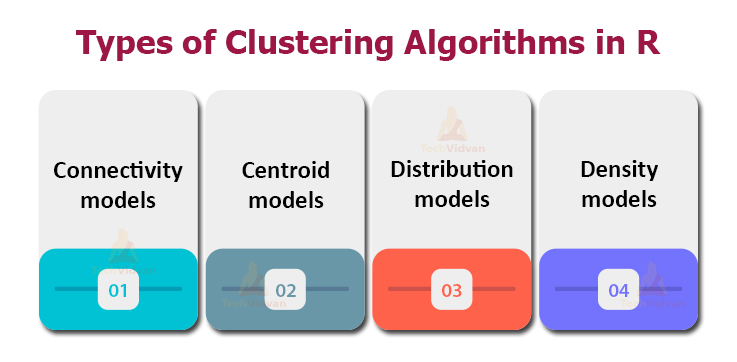
1. Connectivity models
Connectivity based models classify data points into clusters based on the distance between them. The basic principle behind these models is that objects closer to each other are likely to be more similar to each other than objects that are farther away.
Connectivity models may have two different approaches. The first being to divide all points into clusters and then aggregating them as the distance increases. The second approach is to put all points in a single cluster and then divide them into separate clusters as the distance increases. The distance measure can also vary from algorithm to algorithm with euclidian and manhattan distance being most common.
2. Centroid models
Centroid models are iterative clustering algorithms. Their idea of similarity is derived from the distance from the centroid of the cluster. These algorithms require the number of clusters beforehand. With each iteration, they correct the position of the centroid of the clusters and also adjust the classification of each data point.
3. Distribution models
Distribution models differ from the other types of clustering algorithms in that they consider the probability of a data point belonging to a certain cluster instead of any distance measure. These models often suffer from overfitting.
4. Density models
Density models consider the density of the points in different parts of the space to create clusters in the subspaces with similar densities. They isolate various subspaces based on the density of the data point present in them and assign the data points to separate clusters.
There are hundreds of different clustering algorithms available to choose from. Unfortunately, we cannot cover all of them in our tutorial. Therefore, we are going to study the two most popular clustering algorithms in this tutorial.
K-means Clustering in R
K-means is a centroid model or an iterative clustering algorithm. It works by finding the local maxima in every iteration. The algorithm works as follows:
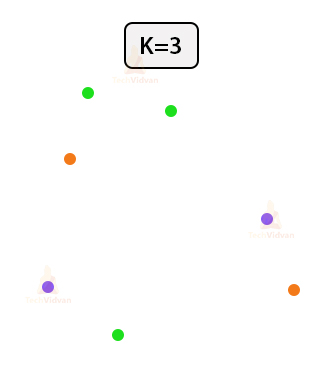
1. Specify the number of clusters required denoted by k.
Let us take k=3 for the following seven points.. This means that two clusters shall exist.
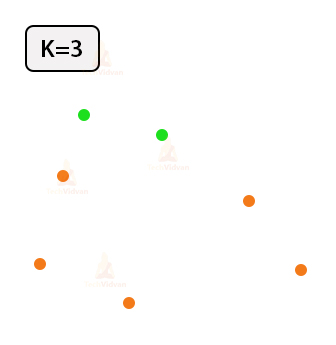
2. Assign points to clusters randomly.
Let us divide the points among the three clusters randomly. The three different clusters are denoted by three different colors.
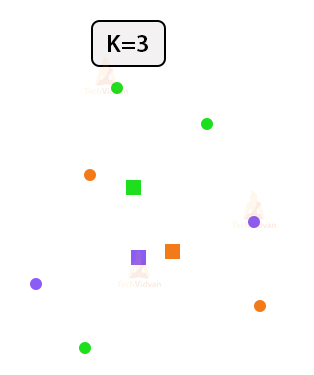
3. Find the centroids of each cluster.
Now, w have to find the centroids for each of the clusters. We mark then as crosses in the diagram below.
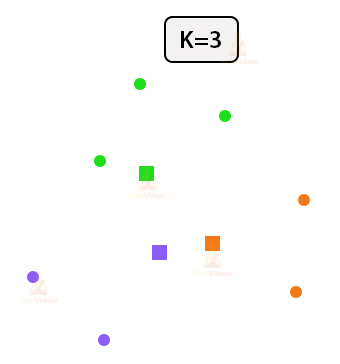
4. Re-assign points according to their closest centroid.
Once we have the centroids, we will re-assign points to the centroid they are the closest two. As you can see in the example below, three points have been reassigned to different clusters.
5. Re-adjust the positions of the cluster centroids.
Adjust the positions of the cluster centroids according to the new points in the clusters.
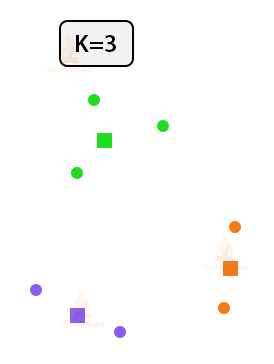
6. Repeat steps 4 and 5 until no further changes are there.
This gives us the final set of clusters with each point classified into one cluster.
Hierarchical Clustering in R
In hierarchical clustering, we assign a separate cluster to every data point. We then combine two nearest clusters into bigger and bigger clusters recursively until there is only one single cluster left. Hierarchical clustering can be depicted using a dendrogram.
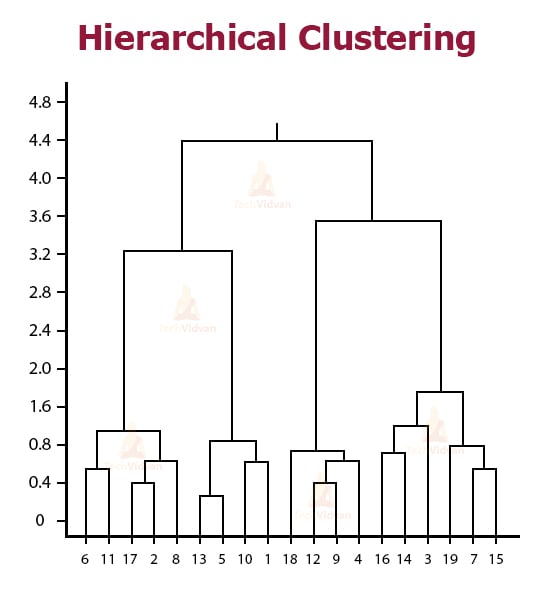
The horizontal axis represents the data points. While height along the vertical axis represents the distance between clusters. Hence, the vertical lines in the graph represent clusters. The height of these lines represents the distance from the nearest cluster. We can find the number of clusters that best represent the groups in the data by using the dendrogram. The vertical lines with the largest distances between them i.e. the largest height on the same level give the number of clusters that best represent the data. In this example, the number of clusters in four as the number of clusters in the tallest level in four.

Practical Implementation of Cluster Analysis in R
Let us implement a clustering algorithm in R. We will be implementing the k-means clustering algorithm on the iris dataset that is inbuilt in R. We will also need the ggplot2 package to plot the graphs.
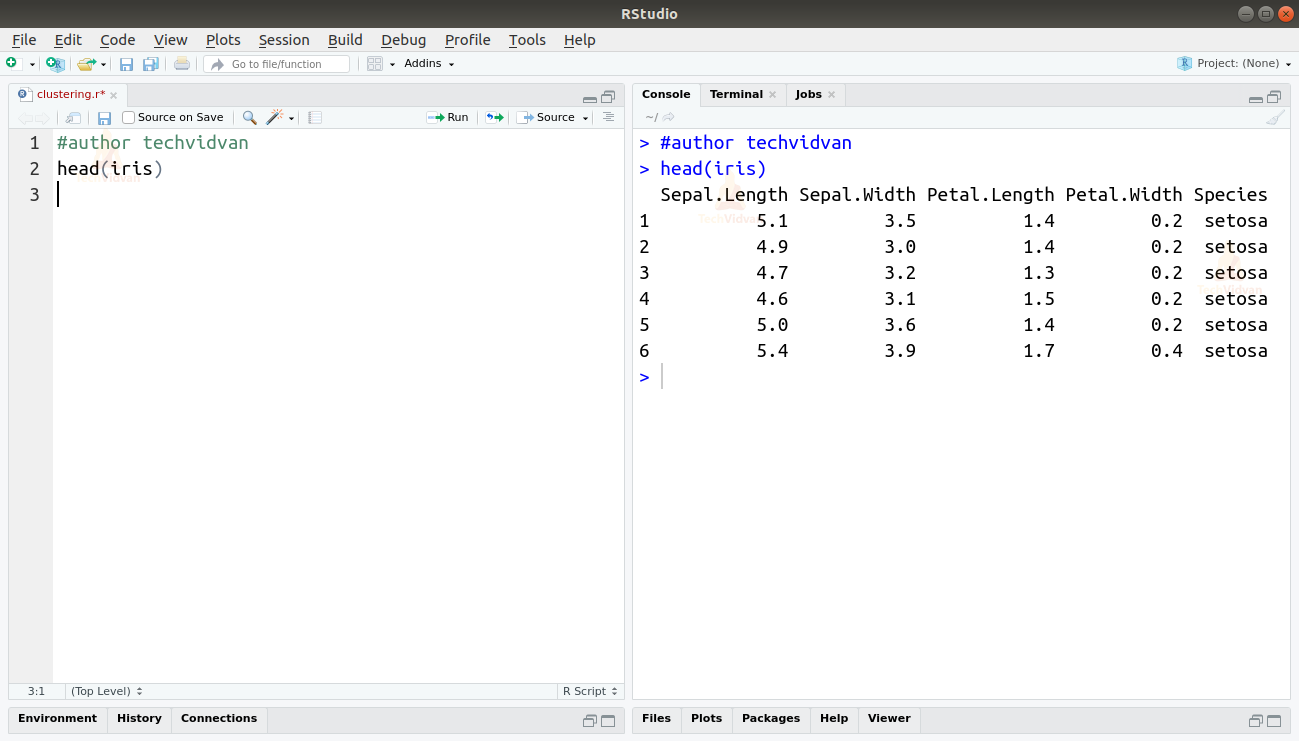
1. Let us explore the data and get familiar with it first.
head(iris)
Output
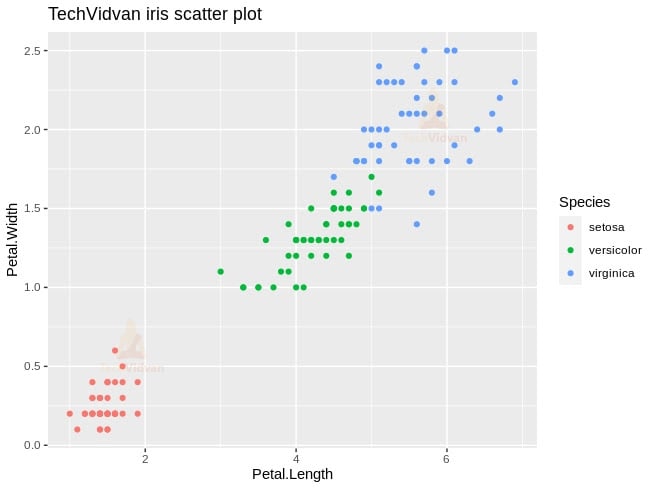
2. As we know, the iris dataset contains the sepal and petal length as well as the width of three different variants of the iris flower. The Petal.Length and Petal.Width is similar for flowers of the same variety but vastly different for flowers of different varieties. This is clear in the following plot.
library(ggplot2)
ggplot(iris, aes(Petal.Length, Petal.Width, col=Species)) + geom_point() + ggtitle("TechVidvan iris scatter plot")
Output
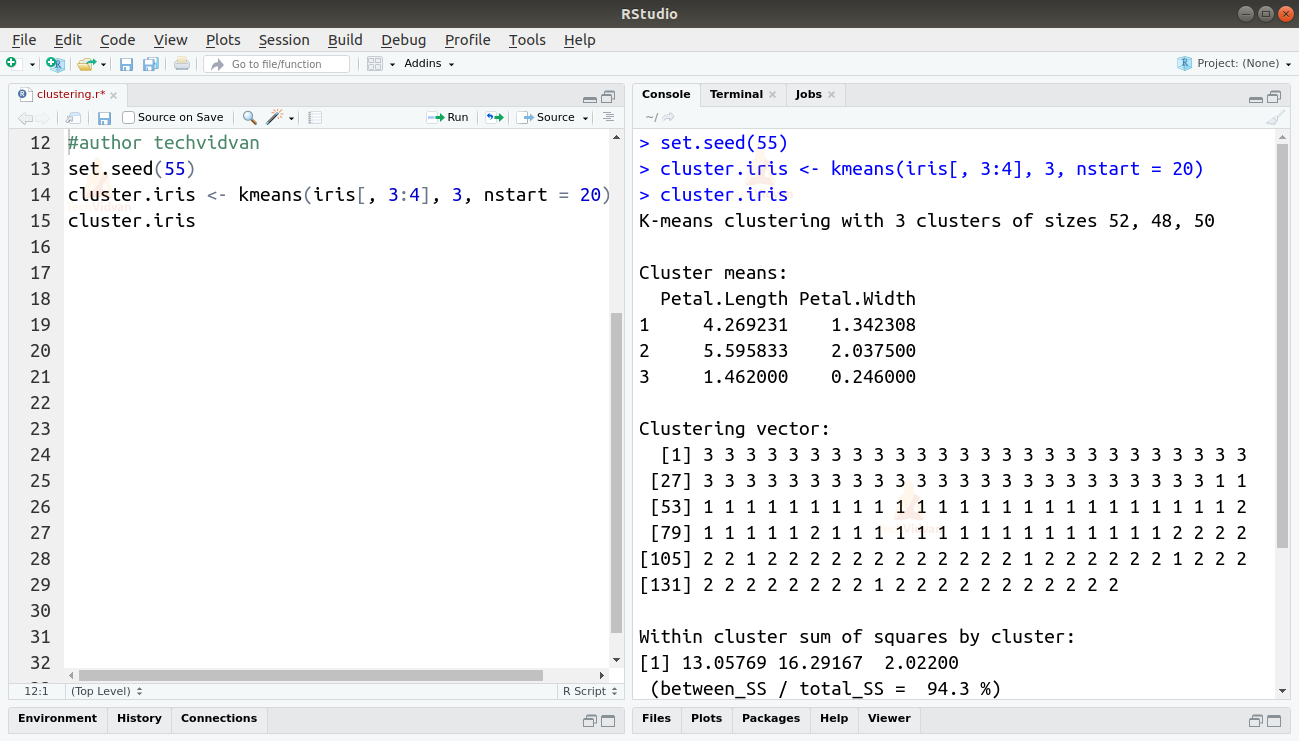
3. Now, we can use the kmeans() function to form the clusters.
set.seed(55)
cluster.iris <- kmeans(iris[, 3:4], 3, nstart = 20)
cluster.iris
Output
4. We can compare the results be forming a table with the species column of the original data.
table(cluster.iris$cluster, iris$Species)
Output

As we can see, all 50 points of the Setosa variety were put in the 3rd cluster. The
Versicolor points were placed in the 1st cluster but two points of this variety were classified incorrectly. The points in the Virginica variety were put into the second cluster but four of its points were classified incorrectly. The accuracy of the model can be calculated as:
A=(50+48+46)/150=0.96
The accuracy is 96%.
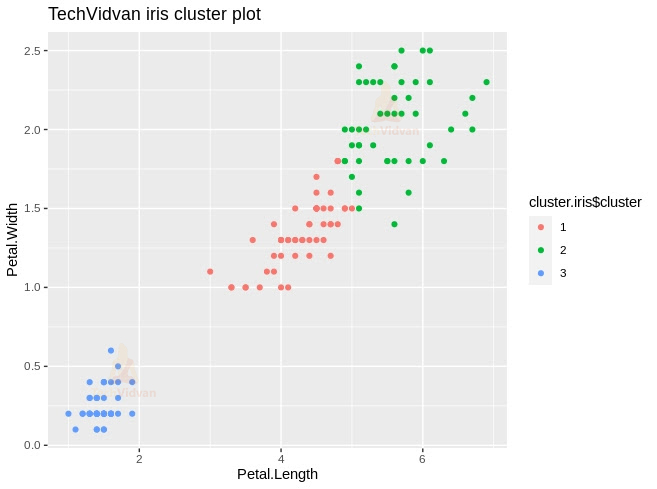
5. We can plot the cluster using ggplot. As the accuracy is high, we expect the plot to look very much like the original data plot.
cluster.iris$cluster <- as.factor(cluster.iris$cluster)
ggplot(iris, aes(Petal.Length, Petal.Width, color=cluster.iris$cluster)) + geom_point() + ggtitle("TechVidvan iris cluster plot")
Output
Summary
In this chapter of TechVidvan’s R tutorial series, we learned about clustering in R. We studied what is cluster analysis in R and machine learning and classification problem-solving. Then we looked at the various applications of clustering algorithms and various types of clustering algorithms in R. We then looked at two most popular clustering techniques of k-means and hierarchical clustering. Finally, we saw an implementation of k-means clustering in R.