How to Perform Hypothesis Testing in R using T-tests and μ-Tests
In this R tutorial, we are going to talk about hypothesis testing in R. We will start off with what is hypothesis testing? We shall, then, move on to decision errors and T-tests. Next, we will look at μ-tests. Finally, we will look at the correlation and covariance in R.
So, let’s not waste any more time and get started.
Hypothesis Testing in R
Statistical hypotheses are assumptions that we make about a given data. Any such hypothesis may or may not be true. Hypothesis testing is the procedure of checking whether a hypothesis about a given data is true or not. In other words, Hypothesis Testing is the formal method of validating a hypothesis about a given data.
To validate a hypothesis, we have to consider all of the data, which is not feasible. To get around this, we select random samples of the data and try to validate the hypothesis according to the samples. Depending on the results of the tests with the samples, we accept or reject the hypothesis.
Types of Hypothesis
In a typical hypothesis test, a single hypothesis is not tested. Instead, we test two mutually exclusive hypotheses. Imagine, we have a bag full of balls. These balls are either black or white in color. These balls are drawn out of the bag randomly and the color of the ball is noted.
There are two kinds of hypothesis in general:
1. Null Hypothesis
A null hypothesis is the base assumption. It is the initial assumption that we make about our data. Let’s say that we make a hypothesis about the above example. The hypothesis is that the number of white balls is larger than the number of black balls. The null hypothesis is denoted as H0.
2. Alternative Hypothesis
An alternative hypothesis is the other hypothesis which is mutually exclusive to the null hypothesis. In this example, the alternative hypothesis could be that the number of black balls is larger than or equal to the number of white balls. Generally, if the null hypothesis is proven incorrect then the alternative hypothesis is assumed to be true. Like in the above example, if the null hypothesis, that there are more white balls than black balls, is proven incorrect then naturally this would mean that the number of black balls is larger than or equal to the number of white balls.
Steps Involved in Hypothesis Testing Process
Hypothesis testing involves the following steps:
1. Stating the hypothesis
The first step in hypothesis testing is to state the null as well as an alternative hypothesis. We have to come up with a hypothesis that gives us suitable information about the data. We have to ensure that the null hypothesis and the alternative hypothesis are mutually exclusive and that they cover a complete scenario i.e. either of them could cover the entire data if proven correct.
2. Devising and analysis plan
Once the hypotheses are created, a suitable plan to analyze the data needs to be made. This includes how to sample the data, how to test the hypotheses, and the decision criteria according to which the validity of the hypotheses will be decided.
3. Analyzing the data
This step involves calculating and interpreting the data to analyze it according to the analysis plan.
4. Interpreting the results
This is the final step of hypothesis testing. In this step, we interpret the results of the analysis and decide the validity of the null hypothesis according to the decision criteria from the analysis plan.
Decision Errors in Hypothesis Testing
There are two possible errors in the decision making of hypothesis testing. These are called decision-making errors. These are:
1. Type I error
During the decision-making process, if the correct null hypothesis is rejected, then such a situation is called type I error. The probability of the occurrence of type I error is expressed by significance level which is denoted by α.
2. Type II error
During the decision-making process, if an incorrect null hypothesis is accepted, then such a situation is called type II error. The probability of the occurrence of type II error is expressed by the power of the test which is denoted by ß.
T-Test for Hypothesis Testing
T-tests are a tool used for hypothesis testing. They are used to determine whether two given samples are different from each other or not. T-tests work on normally distributed data.
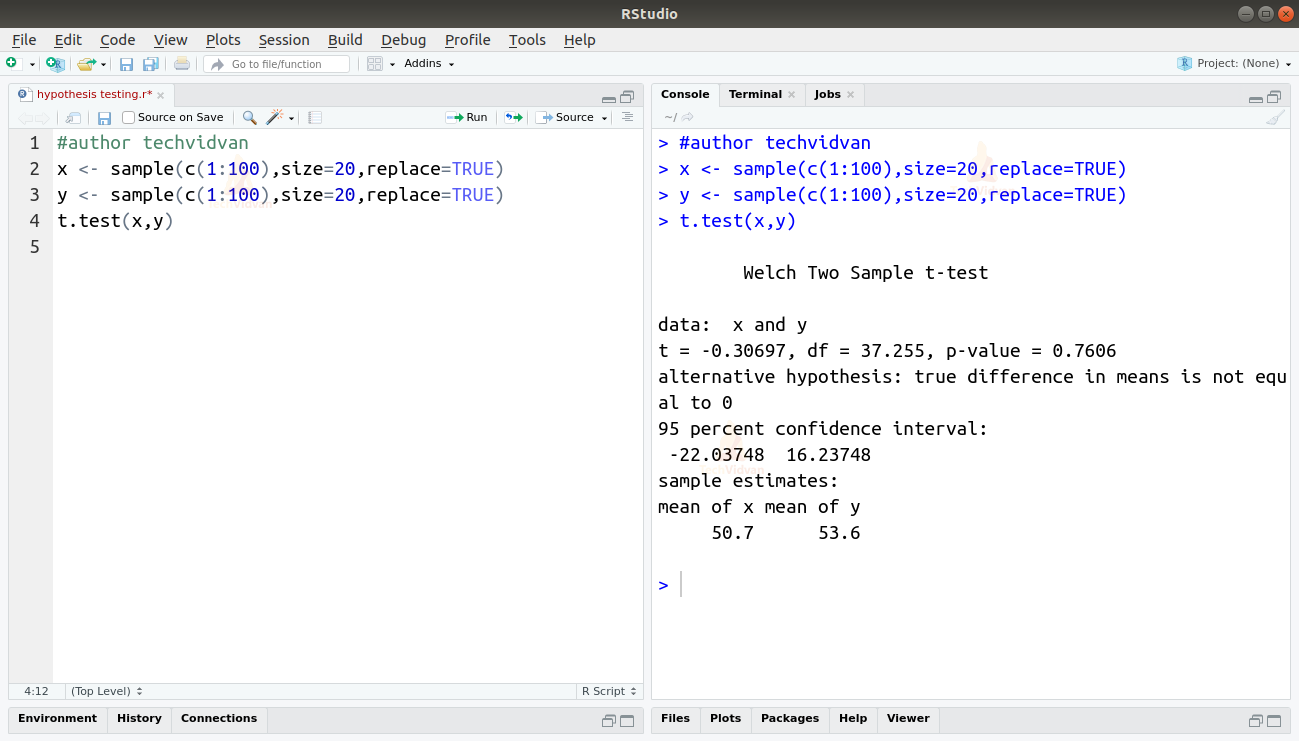
Implementing a T-test is very simple in R. Using the t.test() function, we can compare two vectors of numeric data.
x <- sample(c(1:100),size=20,replace=TRUE)
y <- sample(c(1:100),size=20,replace=TRUE)
t.test(x,y)
Output
T-Test with a Single Sample
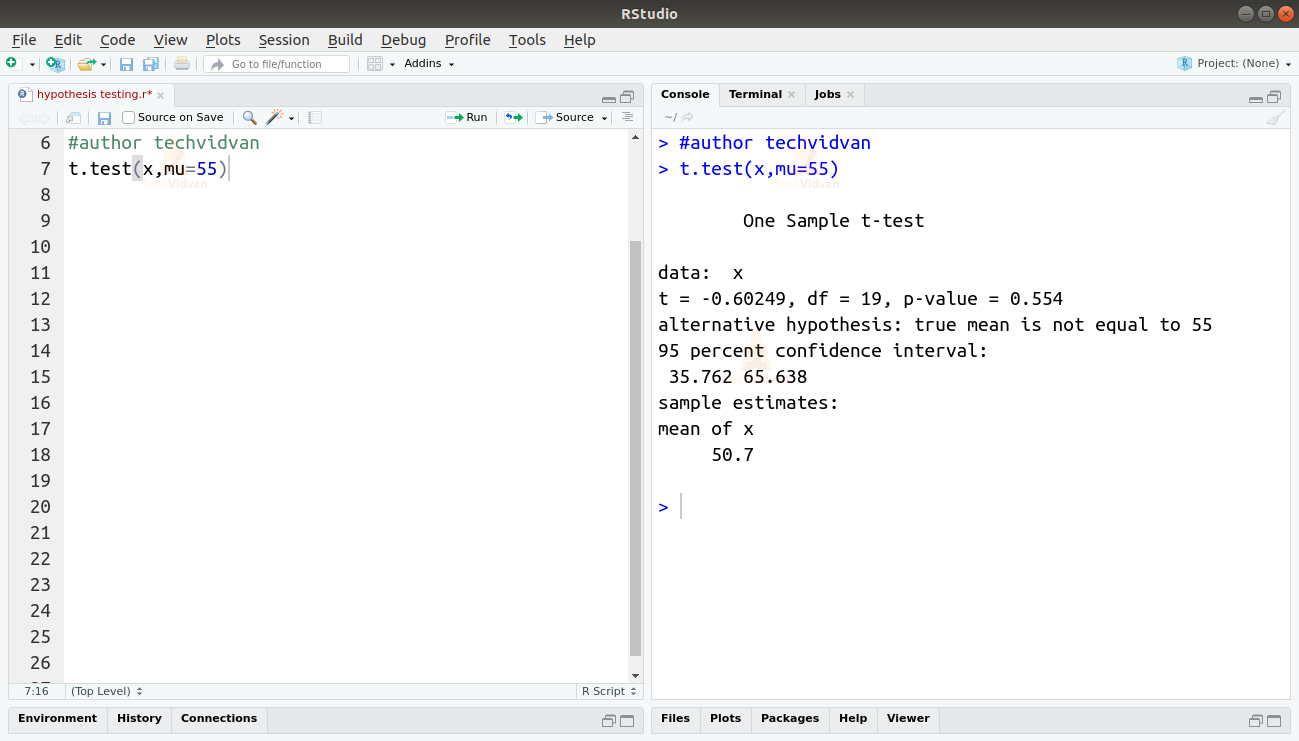
A single-sample t-test is used to check whether the mean of a large dataset is equal to a hypothesized mean value. The t.test() function can take a single sample of a larger data object and the hypothesized mean as input arguments.
t.test(x,mu=55)
Output
T-Test with Directional Hypothesis in R
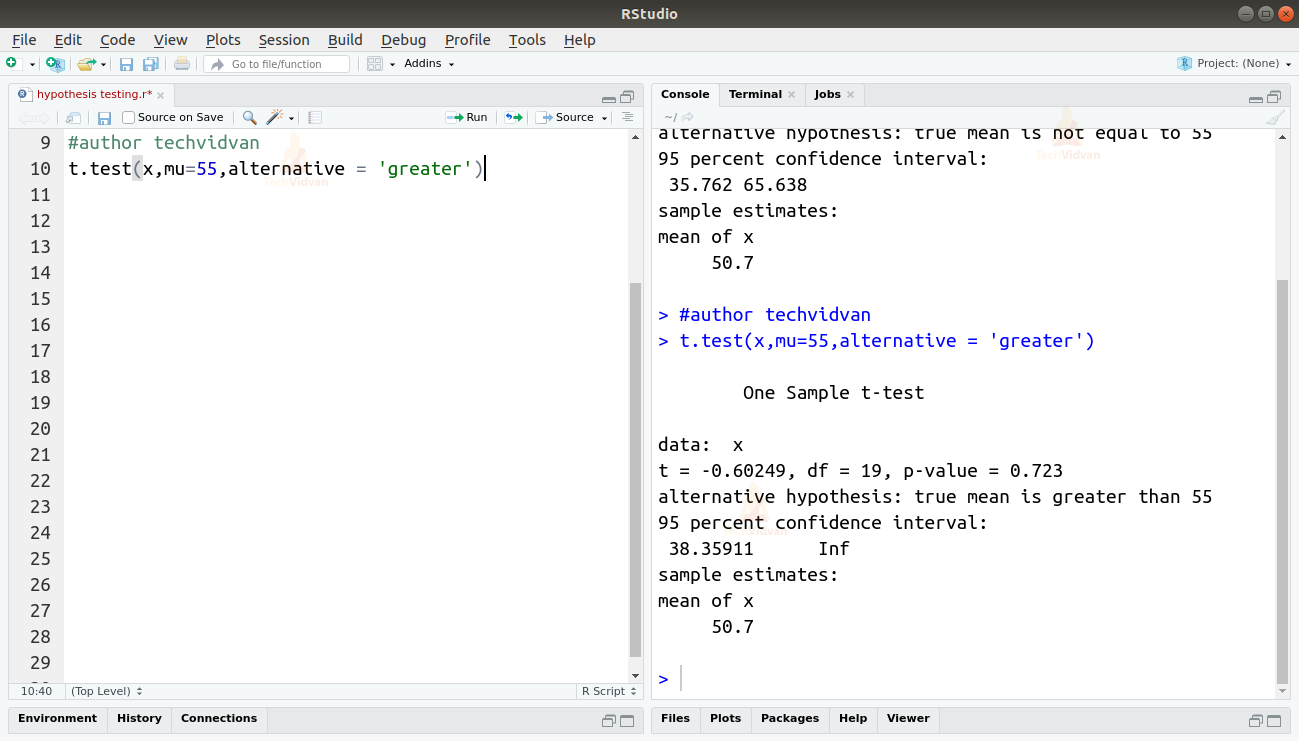
A directional hypothesis is a prediction about the positive or negative difference between two independent variables. For example, if we want to check whether the actual mean is larger or smaller than the hypothesized mean. We can use the alternative argument of the t.test() function.
t.test(x,mu=55,alternative = 'greater')
Output
μ-Test in R
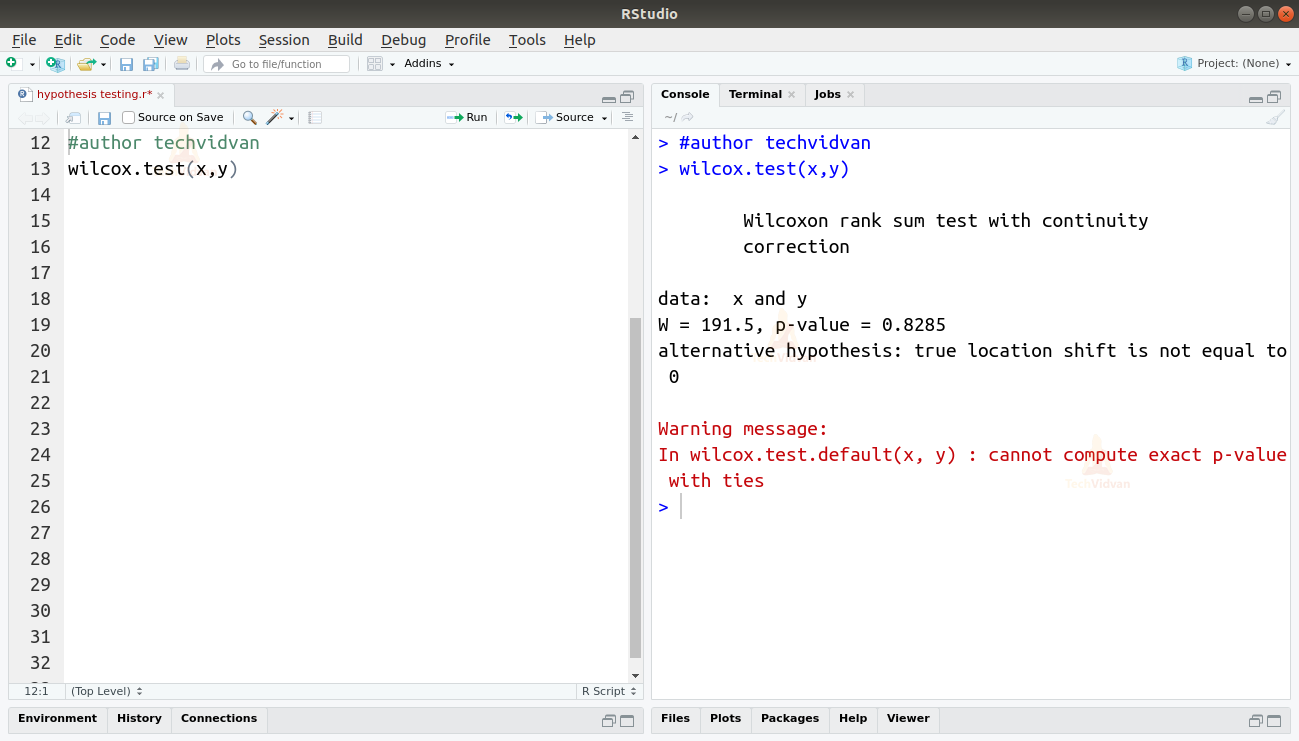
To compare two related samples to check whether their population means are equal, we use μ-Test. μ-Test is also called the Wilcoxon test and can be implemented in R by using the wilcox.test() function.
wilcox.test(x,y)
Output
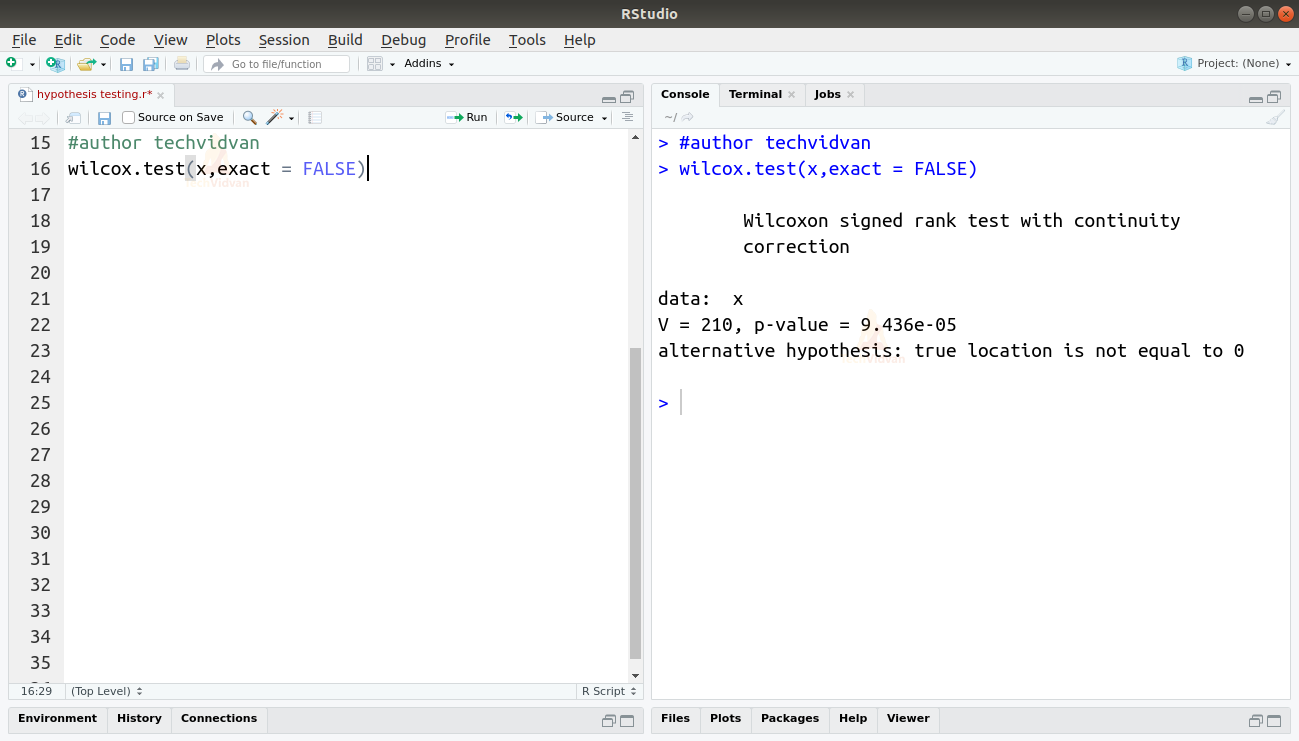
μ-Test with a single sample
The use of a single sample μ-Test is similar to a single sample t-test. They both check the actual value against a hypothesized value. We can perform a single sample μ-Test in R by using the wilcox.test() with a single sample, and the exact argument.
wilcox.test(x,exact = FALSE)
Correlation and Covariance in R
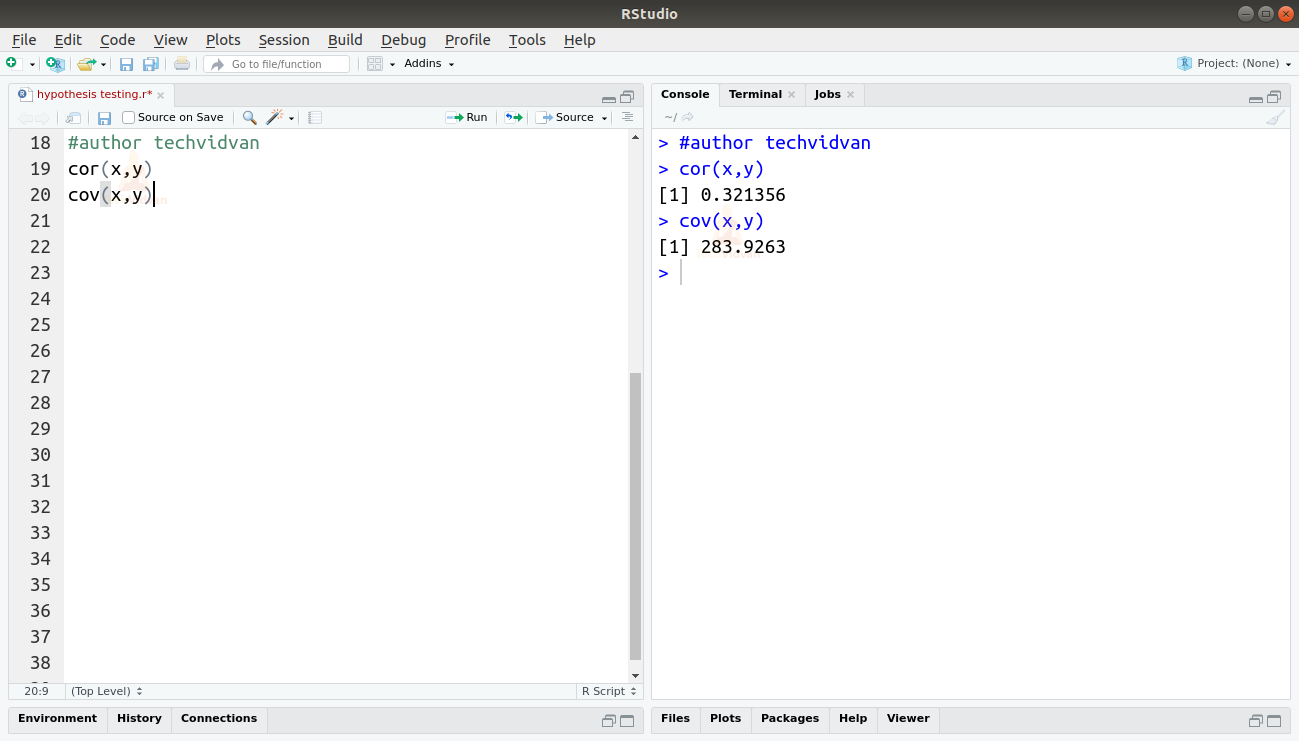
Correlation and Covariance are measures of the relationship between two variables. So they describe how a change in one variable will affect the other. We can find the covariance in R by using the cov() function. Similarly, we can use the cor() function to find the correlation.
cor(x,y)
cov(x,y)
Summary
In this chapter of the TechVidvan’s R tutorials series, we learned all about hypothesis testing in R. We looked at what R hypothesis testing is. We saw how to perform hypothesis testing. Then we studied the t-tests and μ-Tests. Finally, we looked at what correlation and covariance are and how to find them in R.
Hope you liked the article. Do not forget to rate TechVidvan on Google.