Debugging in R – How to Easily Overcome Errors in Your Code?
It doesn’t matter how careful you are or how simple your logic is, bugs are always there to surprise you. Learn the process of debugging in R with few functions.
In this article of our R tutorial series, we will learn about the process of debugging. We will look at popular approaches for debugging your code and about the functions in R that help with this process. We will then study the error handling functions. Finally, we will take a look at the errors and bugs that R packages may contain and how to deal with them.
What is Debugging?
Bugs and errors are ever-present phenomena for programmers all over the world. The larger your code, the more chances of it having bugs.
Since there does not seem to be a way to write bugless code. We need to remove the bugs after writing the code. This process of removing bugs from the code is known as debugging.
The Debugging process
If you were to search for a single documented debugging process, you would not find any, or you would find many different ones. The truth is that there is no single fixed debugging process. In fact, every programmer has their own process that is derived from their programming experience. With practice and experience, you will find what errors and bugs you are prone to, and you will adjust your debugging approach according to that.
While there may not be any dedicated debugging process for any programming language, here is a general process to start you with. You can adjust it with experience and practice.
1. Search for the error on the internet
The first thing recommended by most programmers and us as well would be to search for the error on the internet. Just copy the error statement and search it. If you are lucky, it would be a common error, and you would find how to debug it. Even if you don’t find a proper solution, you may get a general idea of what could be producing the error.
2. Isolating faulty code
Honestly, there is no magic solution to locate where your code is faulty. The only way is to go through your code and find what might not be working.
“Finding your bug is a process of confirming the many things that you believe are true — until you find one which is not true.”
—Norm Matloff
There are ways in which you can reduce this hard work. One popular approach is to split the code into parts. You test these individual parts and try to figure out which one is not working. Then you split the faulty code further and further until you isolate the part where the problem is occurring.
3. Making it repeatable
Once you have isolated a part of the code that you believe is the root of the problem, you will have to repeatedly execute it with different changes to identify the bug and debug it. You have to make it so that you can execute that part of the code on its own again and again. After that, make small changes in the code and execute it. Every try will give you more insight into the problem and its causes.
4. Fixing and testing
As you finally identify the problem, correct it and test it again with different scenarios to ensure that the fix works. After that, you can put it back into the whole code and test the entire code again.
R Functions that Help in Debugging
In R programming, there are a few functions that help in the debugging process. They can help in isolating the bugs or even show you the behind-the-scenes details of the code so that you can identify where the problem is actually occurring. These functions are:
- traceback()
- debug()
- browser()
- trace()
- recover()
Let’s look at these functions one-by-one.
1. traceback() Function
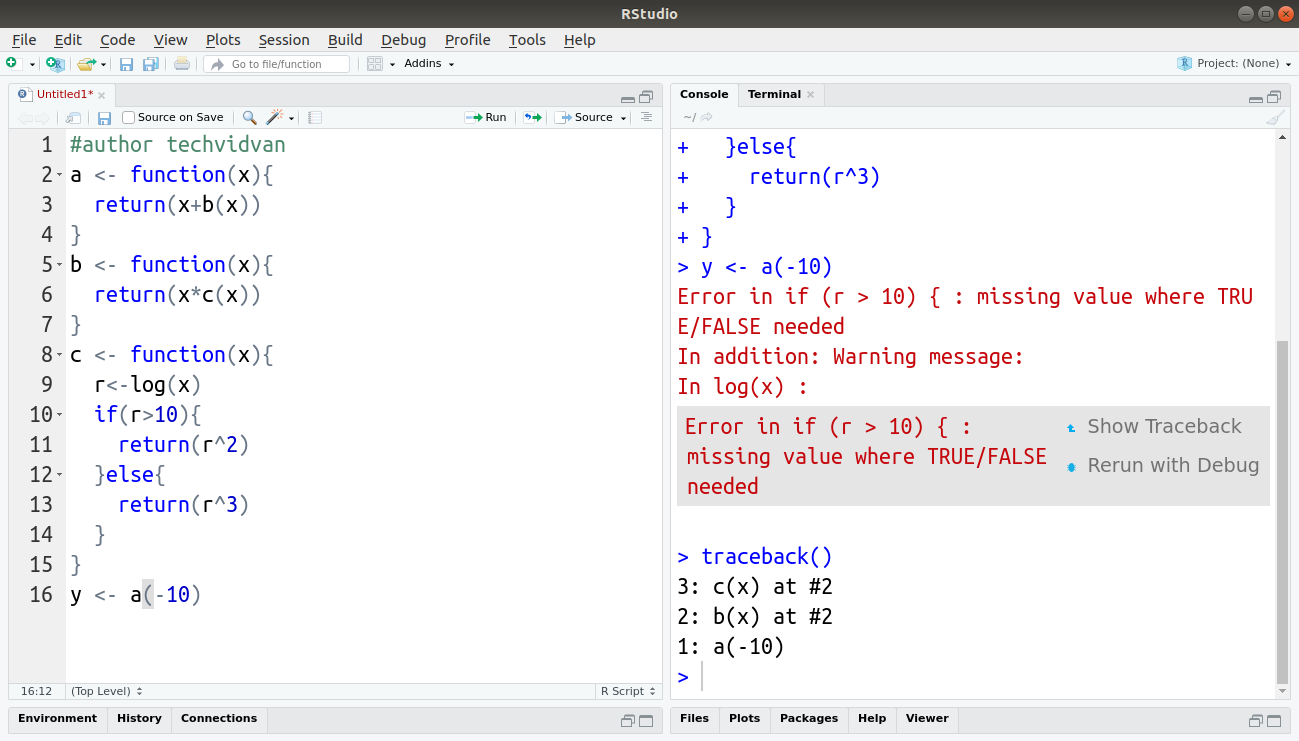
The traceback() function acts as a history viewer. It shows you which functions and statements were executed before the error occurred. This way you only have to check the functions that were executed before the error occurred and not all of them. This function shows us the call stack of the error i.e it shows us the list of the calls that lead to that error. In RStudio, when an error occurs, the IDE gives you the option to run the traceback() function automatically. You can easily call the function by clicking the Show Traceback option.
Code:
a <- function(x){
return(x+b(x))
}
b <- function(x){
return(x*c(x))
}
c <- function(x){
r<-log(x)
if(r>10){
return(r^2)
}else{
return(r^3)
}
}
y <- a(-10)
Output:
2. debug() Function
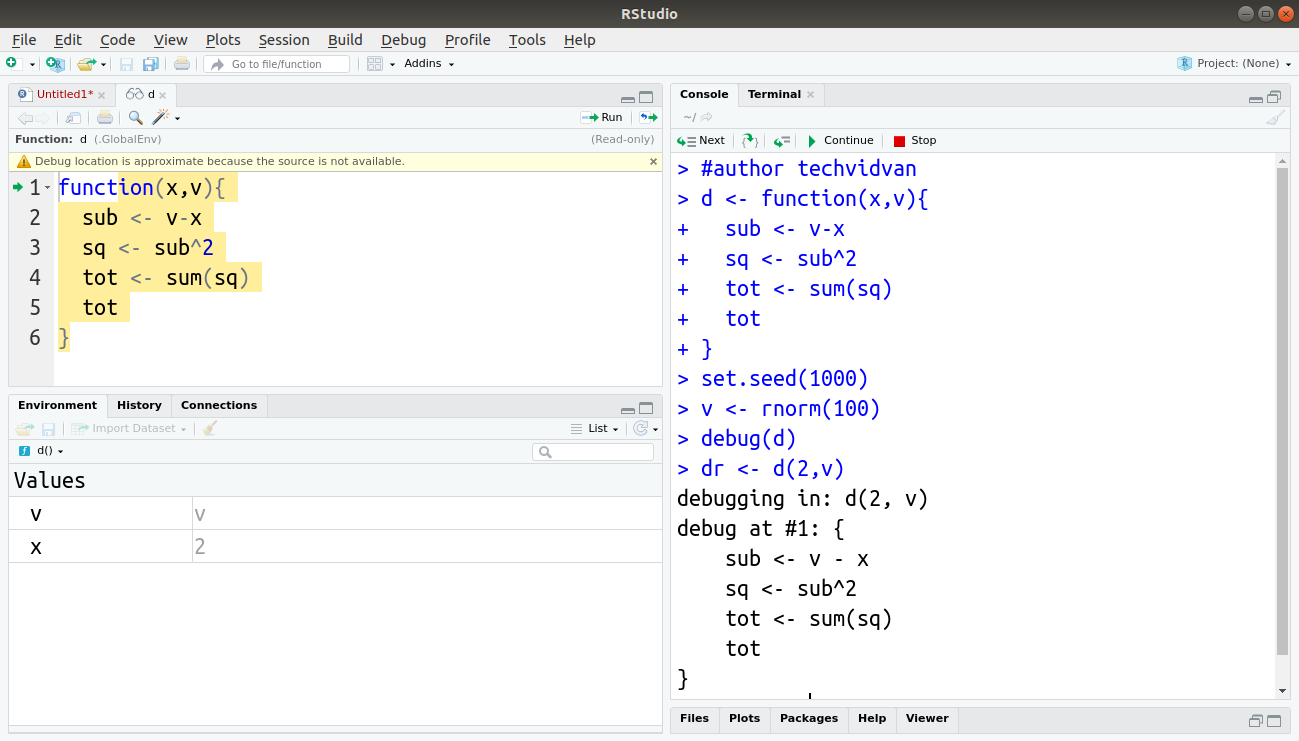
The debug() function allows you to see the execution of the code step-by-step. It executes the program one step at a time and only proceeds when prompted. When the debug() function is called, your IDE enters the debug mode. In the debug mode, the part of the code that is suspected to be faulty is highlighted. You can see the state of the variables and objects at every step of the code’s execution. This way, you can see at exactly which step the problem started and correct it.
Code:
d <- function(x,v){
  sub <- v-x
  sq <- sub^2
  tot <- sum(sq)
  tot
}
set.seed(1000)
v <- rnorm(100)
debug(d)
dr <- d(2,v)
Output:
3. browser() Function
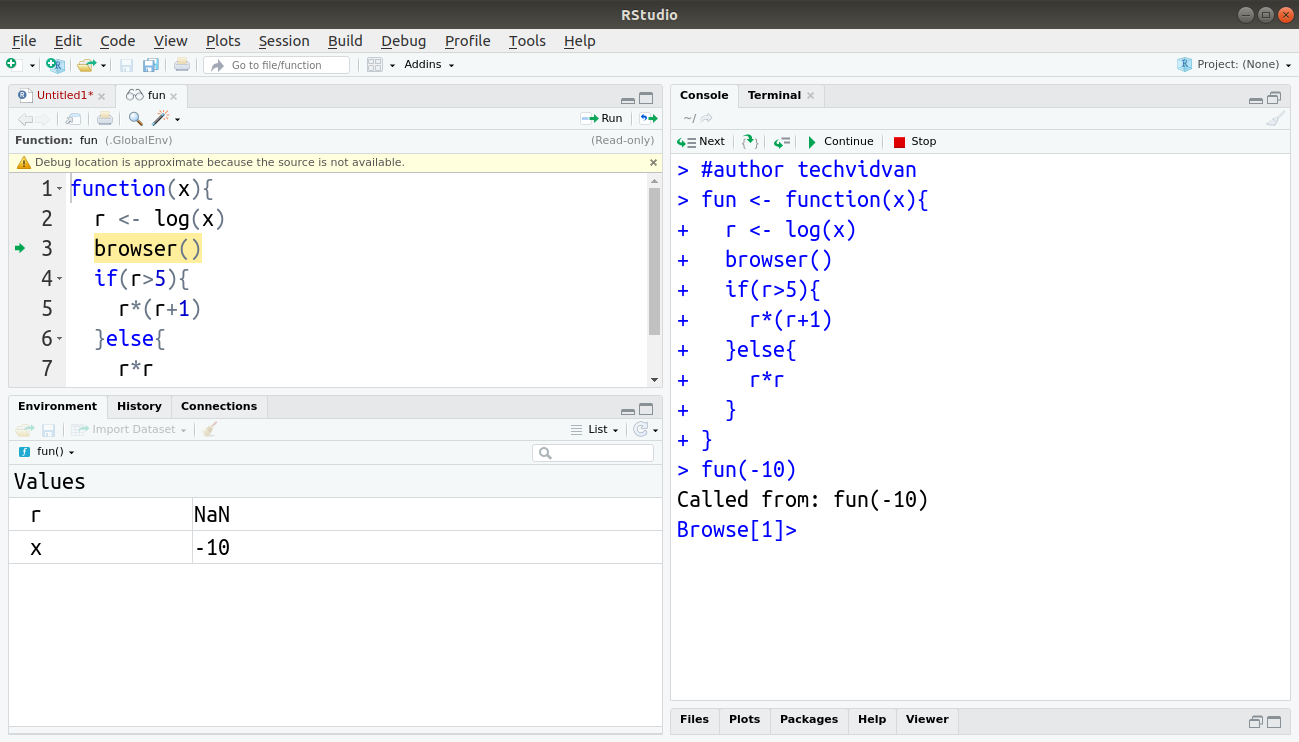
The browser() function is similar to the debug() function. It stops the execution of code and proceeds only when prompted. You can insert a call to the browser() function anywhere in your code and its execution will pause when the function is called.
As soon as the browser() function is called, the IDE enters the debug mode and the execution of the code continues in a step-by-step fashion. You can check the state of the program and continue if you wish to.
Code:
fun <- function(x){
  r <- log(x)
  browser()
  if(r>5){
    r*(r+1)
  }else{
    r*r
  }
}
fun(-10)
Output:
4. trace() Function
The trace() function allows you to insert bits of code inside your program. You can use this to insert alerts and corrections into your code. The most common use of this function is to insert a call to the browser() function before a suspected break-point in the code. Let’s observe the following code.
Code:
set.seed(5656)
trace_test <- function(x){
  r <- log(x)
  if(r>=10){
    return(r)
  } else{
    return(2*r)
  }
}
val <- rnorm(50)
trace_test(val)
Output:
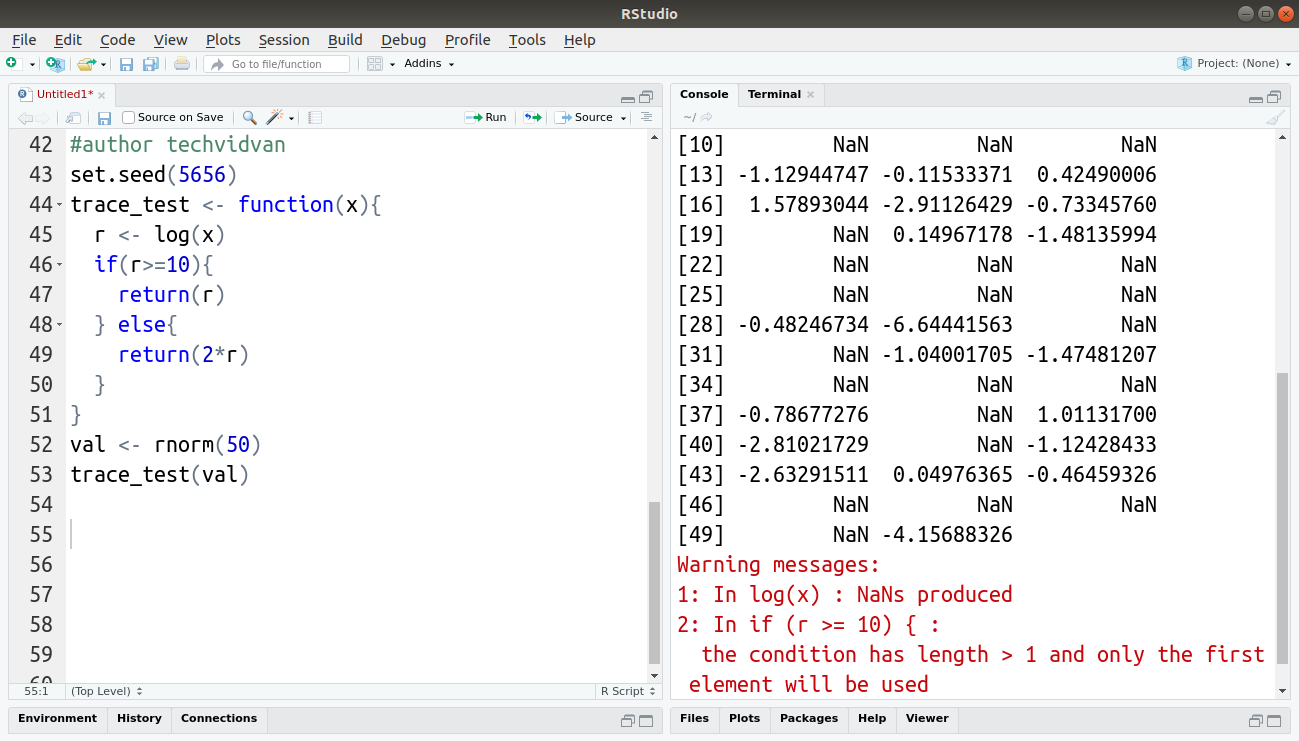
As you can see, the rnorm() function, which generates random numbers have produced values that return non-numeric values when passed to the log() function. The function gives a warning about the NAN values and returns a NAN output.
Here, using the debug() function would be very difficult, and a long process as the function makes a lot of calls. Instead, we can use the trace() function to insert a line that would pause the function when a NAN value is produced and enter debug mode.
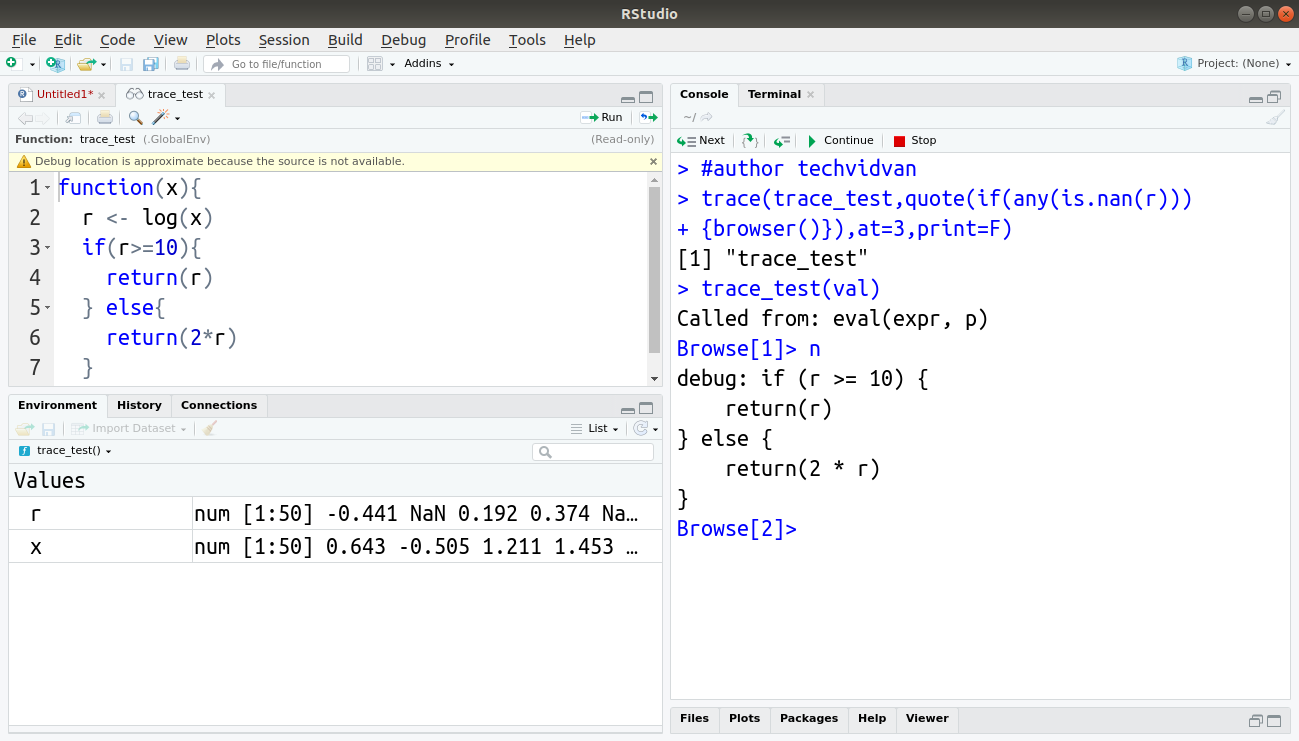
Code:
trace(trace_test,quote( if(any(is.nan(r))){browser()} ), at=3, print=F)
Code:
trace_test(val)
Output:
5. recover() Function
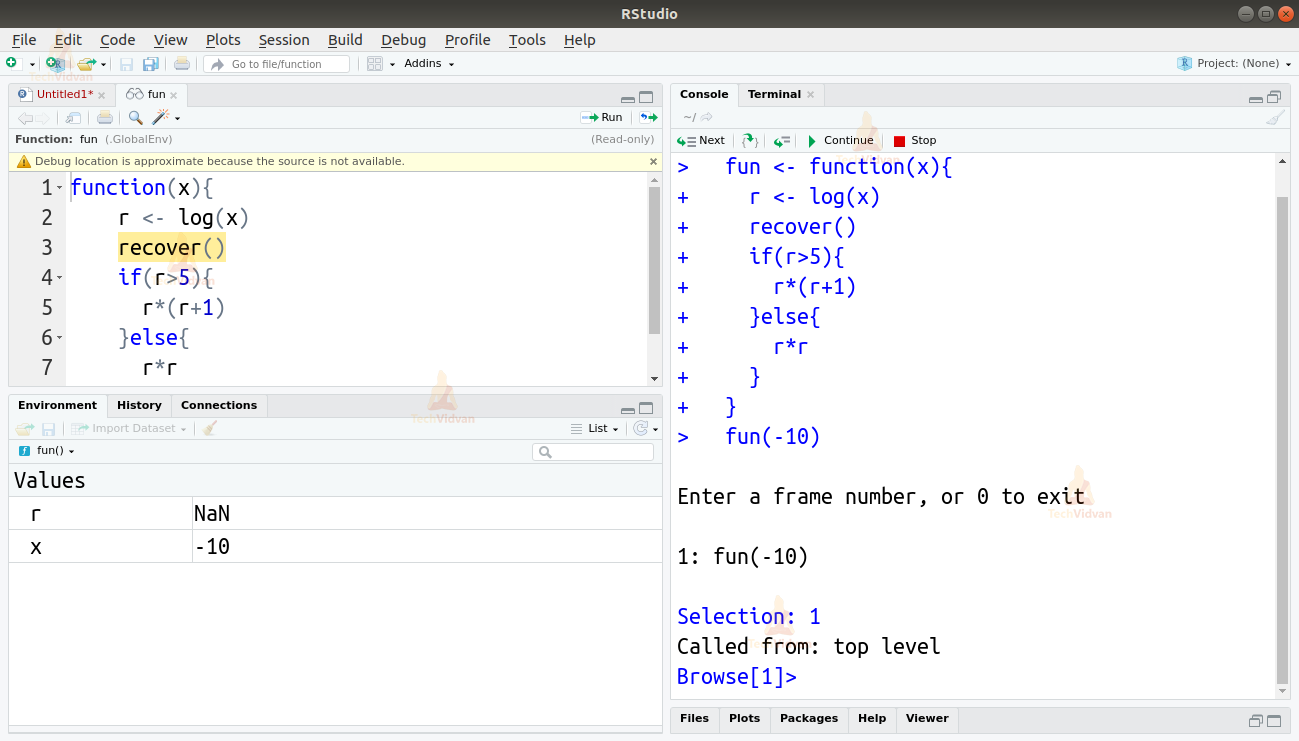
The recover() function shows you the state of the variables in the upper-level functions. We can use it as an error handler. It halts the execution at the point of failure and shows the environment of the program at that time. It is very similar to the browser() function in its working. The recover() function forces the IDE into the debug mode, and the program continues step-by-step. Using the recover() function, you can see the state of all the objects and variables after every statement is executed. The execution moves to the next step only when prompted.
Code:
fun <- function(x){
  r <- log(x)
  recover()
  if(r>5){
    r*(r+1)
  }else{
    r*r
  }
}
fun(-10)
Output:
try() and trycatch() Functions
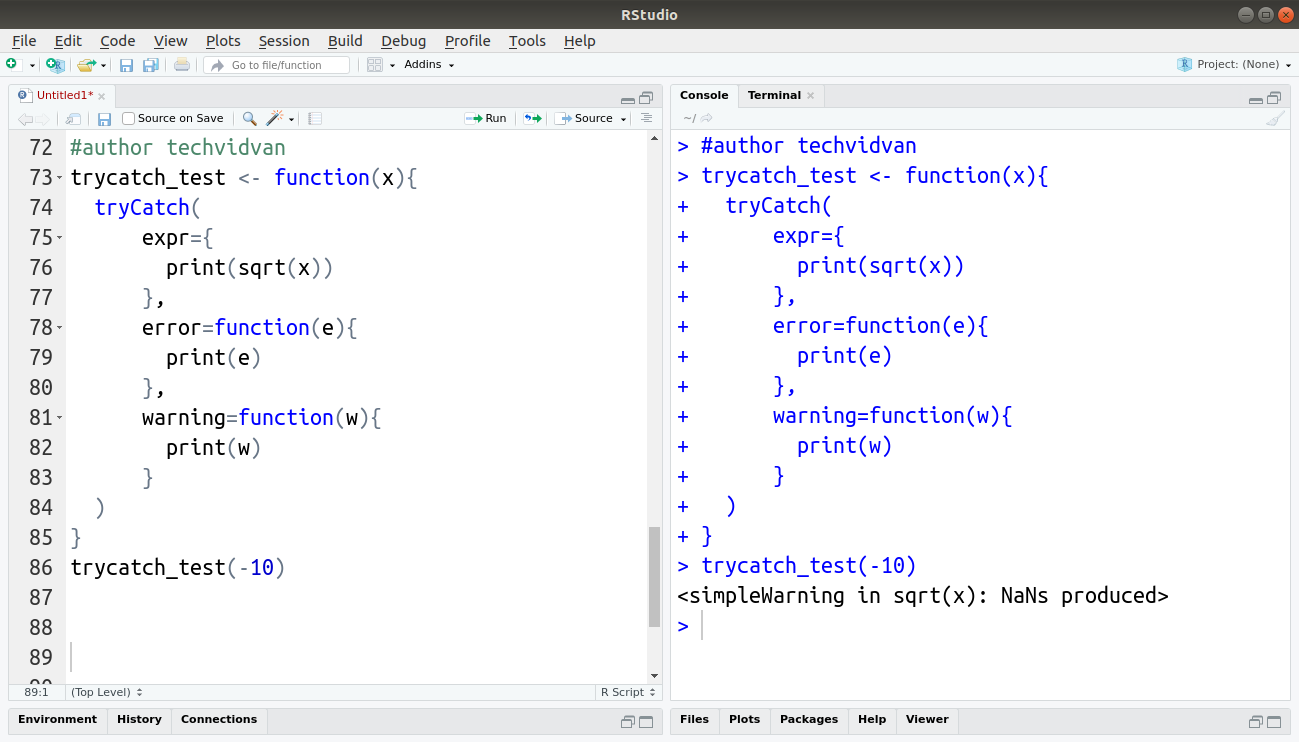
The try() and the trycatch() functions are two functions provided in R that help with exception handling. We can encapsulate a block of code that we suspect to be faulty or error-prone inside the try() function. If the code block throws an error, the try block bypasses its execution, and the program continues. We use the trycatch() function to catch the failed execution of the try() function and give an appropriate response or warning to show the failed execution of the try() function block.
Code:
trycatch_test <- function(x){
  tryCatch(
      expr={
        print(sqrt(x))
      },
      error=function(e){
        print(e)
      },
      warning=function(w){
        print(w)
      }
  )
}
trycatch_test(-10)
Output:
Errors from Installed Packages
There are more than 15,000 packages on CRAN repository. Developers from all over the world submit hundreds of new packages every month. The CRAN repository has a checking process, but bugs still make it through them. As a result, the packages uploaded on the CRAN repository may also have bugs in them. You can either choose some alternative if such a problem occurs or try to debug them yourself. There are a few ways to debug R packages: Read the package’s documentation, it may provide clues to why the error is occurring when it does and is it intentional for some reason. It may also tell you how to rectify it.
- By setting options(error=recover), the execution will stop when a function inside a package fails. Then you can go through the code to identify the bug.
- You can download the source code of the package and go through it to isolate, identify, and rectify the problem.
- You can also use the devtools package to make this process much easier for you.
You can even manage R packages if the problem continues.
Summary
Like any other programming language, bugs are an unfortunate certainty in R. By employing a systematic debugging approach, you can make the debugging process easier for you.
In this TechVidvan tutorial, we looked at the tools and functions that help with the debugging process in R. We learned the recommended ways to approach a debugging issue. We studied the exception handling functions. Finally, we looked at the errors caused by the downloaded packages and how we can resolve those.
Still, if you have any doubts related to debugging in R, feel free to share in the comment section below.
If you like our work then do share our article with your friends as well.
Keep learning!!