Customer Churn Prediction with Machine Learning
With this Machine Learning Project, we develop a customer churn analysis. We use Random Forest Classifier, xgboost in this ml project. So, let’s build this system.
Customer Churn
One of the key sectors in developed nations is now telecommunications. The degree of competition increased due to both technological advancement and increased operators. Businesses are putting a lot of effort into surviving in this cutthroat market by utilizing various techniques. To increase revenue, three basic ideas have been put forth:
(1) Obtain new clients,
(2) upsell to current clients, and
(3) lengthen consumer retention times.
The third strategy, which proves that keeping an existing customer costs much less than acquiring a new one and is also thought to be much easier than the upselling strategy, is, however, the most profitable strategy when comparing these strategies while taking the value of return on investment (RoI) of each into account. Companies must lower the likelihood of customer churn, also referred to as “the consumer transfer from one provider to another,” in order to implement the third method.
A customer loss is directly related to the loss of the company’s profit. Customer loyalty and loss are closely related concepts. Price reductions are not the only approach to increasing consumer loyalty, there are other things that the company has to take care of if they don’t want to lose customers. To maintain repeat business, it is important to provide additional value-added services to the products to increase the sales of that products.
Customer churn research aims to identify customers who are likely to leave and estimate the cost of winning them back. The definition of churn is a crucial component of the analysis. Making a definition might be exceedingly challenging in some situations. For instance, a credit card holder can easily switch to using a credit card from a different bank without cancelling their present card. In this particular instance, the client’s loss can be understood by considering a decrease in expenditures.
For businesses that are inclined to lose consumers quickly, customer loss is a serious issue. Examples include banks, insurance businesses, and telecommunications firms (Lazarov, 2007).
In highly competitive service sectors, customer churn is a significant problem. On the other hand, identifying the clients who are most likely to quit the business might represent a sizable new revenue source. Numerous studies have shown that machine learning technology effectively predicts this circumstance. It involves learning from prior data to apply this method.
Random Forest
Random forests are made up of trees whose values are determined by the same random vector which is also collected randomly. For forests, the generalization error converges as the number of trees in the forest increases. The strength of each individual tree in the forest and the correlation between them determine the generalization error of a forest of tree classifiers. Each node is split using a random selection of features, producing error rates comparable to Adaboost but more resilient to noise.
A large number of decision trees are built during the training phase of the random forest or random decision forest. Most trees choose the output of the random forest for classification problems. The mean or average prediction of each individual tree is returned for regression tasks. The tendency of decision trees to overfit their training set is corrected by random decision forests. Although they frequently outperform decision trees, random forests are less accurate than gradient-boosted trees. However, their effectiveness may be impacted by data peculiarities.
Apparently, to gauge each variable’s predictive power, random forests additionally build a different variable important measure using the OOB samples. The OOB samples are transmitted down the bth tree as it grows, and the prediction accuracy is noted. The accuracy is then calculated again after the t values for the jth variable that have been randomly permuted in the OOB samples. The average accuracy loss, brought on by this permuting, is applied to all trees to determine the significance of variable j in the random forest. The relevance in the right plot is more evenly distributed throughout the variables, despite the similarity in ranks between the two methods. Similar to setting a coefficient to zero in a linear model, randomization essentially eliminates the effect of a variable. Because other variables might be used as a hold if the model were updated without the variable.
XGBoost
The gradient boosting technique has been scaled and enhanced, and the result is eXtreme Gradient Boosting (XGBoost), which was created for effectiveness, computational speed, and model performance. It belongs to the Distributed Machine Learning Community and is an open-source library.
The software and hardware features of XGBoost are the ideal combination for enhancing current boosting methods accurately and quickly. Here is a quick comparison of XGBoost and various gradient-boosting algorithms using an objective benchmark trained on a random forest with 500 trees. Generally boosting means improving performance.
A weak hypothesis or weak learners are turned into strong learners using the sequential ensemble learning technique known as “boosting” in machine learning. This increases the model’s accuracy. By using a straightforward classification example—classifying a Twitter account as a Bot or Human using underlying rules—we can see why boosting is necessary.
Project Prerequisites
The requirement for this project is Python 3.6 installed on your computer. I have used Jupyter notebook for this project. You can use whatever you want.
The required modules for this project are –
- Numpy(1.22.4) – pip install numpy
- Sklearn(1.1.1) – pip install sklearn
- Pandas(1.5.0) – pip install pandas
That’s all we need for our project.
Customer Churn Prediction Project
Please download the source code and dataset for customer churn prediction project. you can download them from the following link: Customer Churn Prediction Project
Steps to Implement
1. Import the modules and all the libraries we would require in this project.
import pandas as pd#importing the pandas library
import numpy as np#importing the numpy library
import seaborn as sns#importing the seaborn library
import matplotlib.pyplot as plt#importing the matplotlib library

from sklearn.preprocessing import LabelEncoder#importing the label encode library

import xgboost as xgb#importing the xgboost library
from sklearn.ensemble import RandomForestClassifier#importing the random forest classifier library

from sklearn.model_selection import train_test_split#importing the train test split library
from sklearn.preprocessing import StandardScaler#importing the standard scalar library
from sklearn.metrics import accuracy_score, f1_score,confusion_matrix,classification_report#importing the confusion matrix and classification report library
2. Here, we read the dataset and create a function to process our dataset. Here we have used pandas to drop some unnecessary columns and create a new data frame with it.
Here we are reading the dataset and we are creating a function to do some data processing on our dataset. Here we have used pandas to drop some unnecessary columns and then we are creating a new data frame with it.
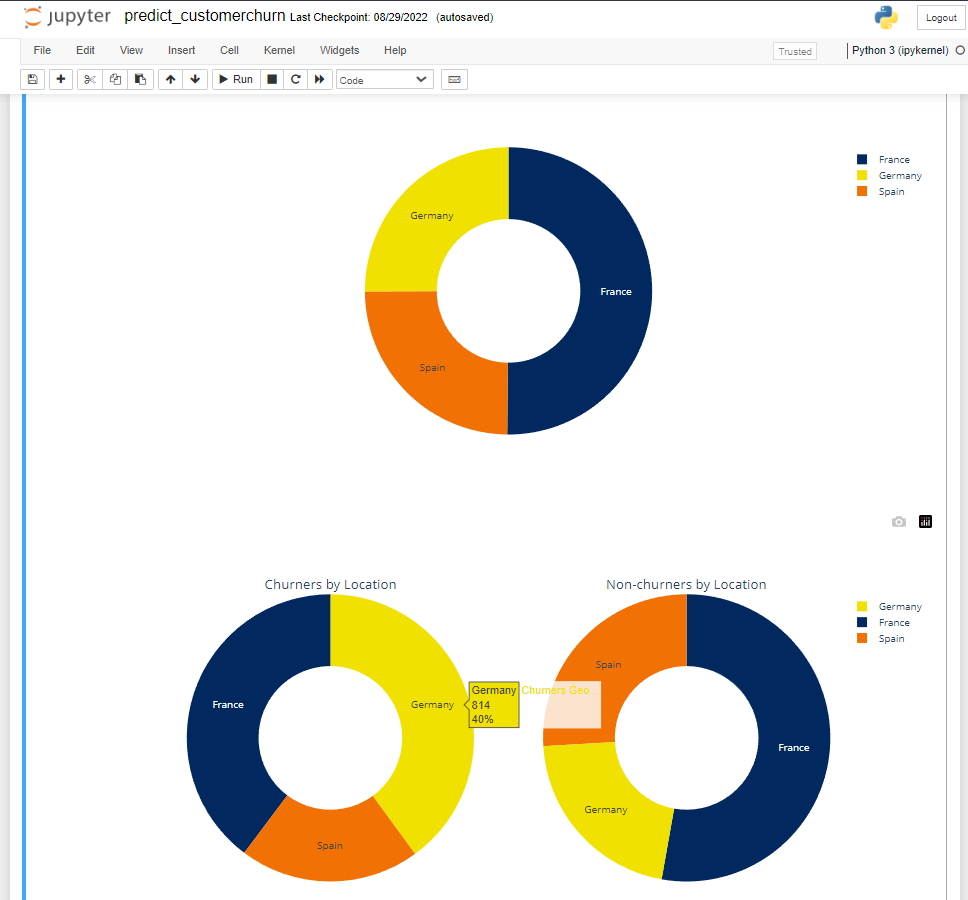
3. We are giving color palettes to Germany, France, and Spain. We use the hashcodes to give the colors, and then we are giving the colors to the different countries.
columns_pallete={"Germany": "#F0E100", "France": "#01295F", "Spain": "#F17105"}#taking some palette columns
dataframe_palette=pd.DataFrame(columns_pallete.items(), columns=['Geography', 'Color'])#creating the palette dataframe
dataframe_palette
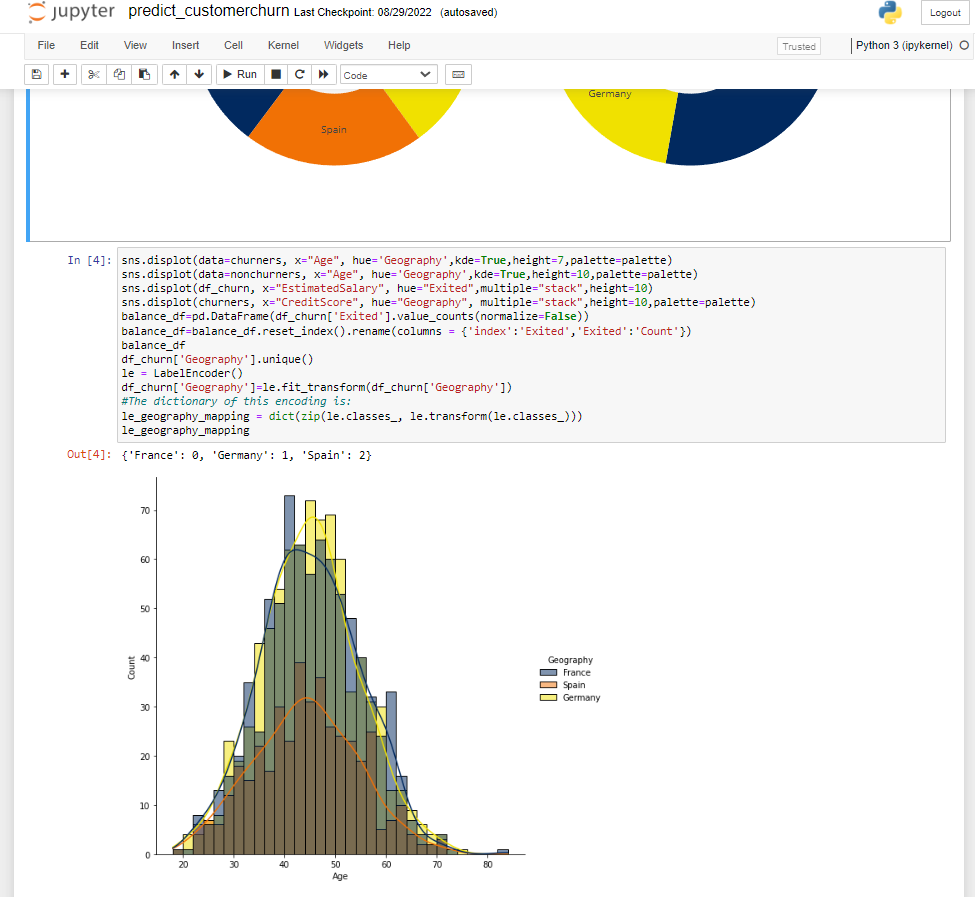
4. We divide our dataset into X and Y, where x is the independent variable, whereas y is the dependent variable. Then we use the test train split function to divide the X and Y into training and testing datasets. We take the percentage of 75 and 25% for training and testing respectively. Here we have used a label encoder to assign a value to every, which will make it easier to process and work on the dataset. Then we use the XGB classifier and we pass our testing and training dataset to the classifier.
dataframe_balanced=pd.DataFrame(dataframe['Exited'].value_counts(normalize=False))##taking some excited column columns
dataframe_balanced=dataframe_balanced.reset_index().rename(columns = {'index':'Exited','Exited':'Count'})#creating the balanced dataframe
dataframe_balanced

label = LabelEncoder()#creating the label encoder
dataframe['Geography']=label.fit_transform(dataframe['Geography'])
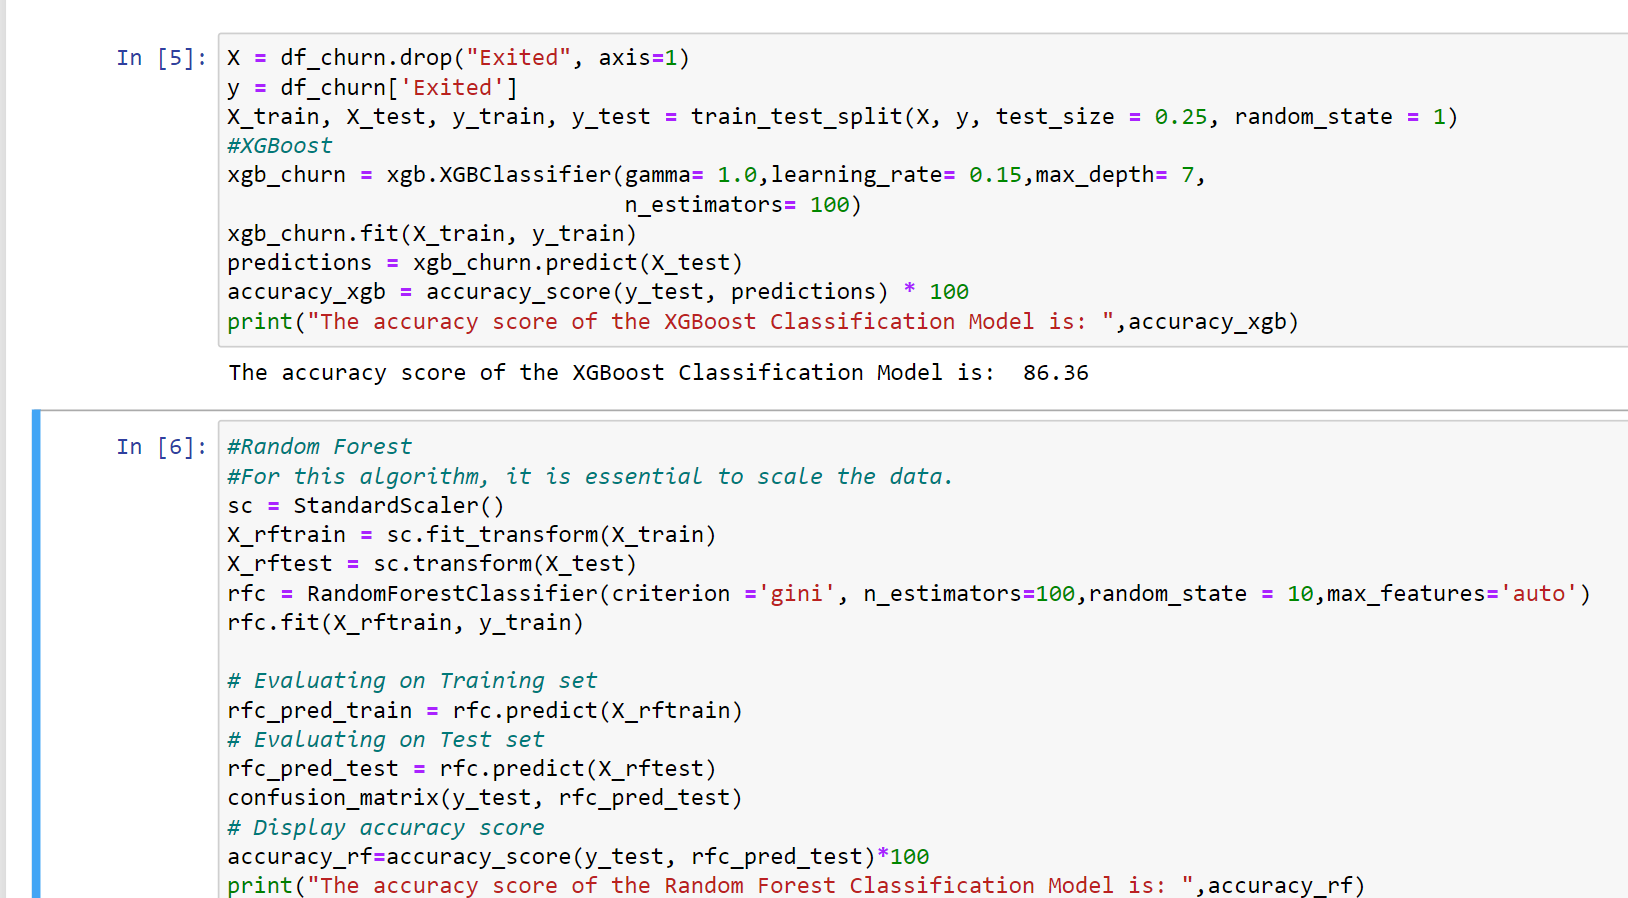
5. Here we are using the xgboost model and the accuracy of this model comes out to be 86.36%.
label_encoder= dict(zip(le.classes_, le.transform(le.classes_)))
label_encoder
x_dataset = dataframe.drop("Exited", axis=1)#creating the x dataset
y_dataset = dataframe['Exited']#creating the y dataset
X_train, X_test, y_train, y_test = train_test_split(x_dataset , y_dataset , test_size = 0.25, random_state = 1)

xgb_model= xgb.XGBClassifier(gamma= 1.0,learning_rate= 0.15,max_depth= 7,
                              n_estimators= 100)
xgb_model.fit(X_train, y_train)#fitting the dataset into model

pred_values= xgb_model.predict(X_test)#predicting the testing values
xgb_accuracy = accuracy_score(y_test, pred_values) * 100 #calcualting the accuracy of the model
print("The accuracy score is: ",xgb_accuracy )#printing the accuracy score
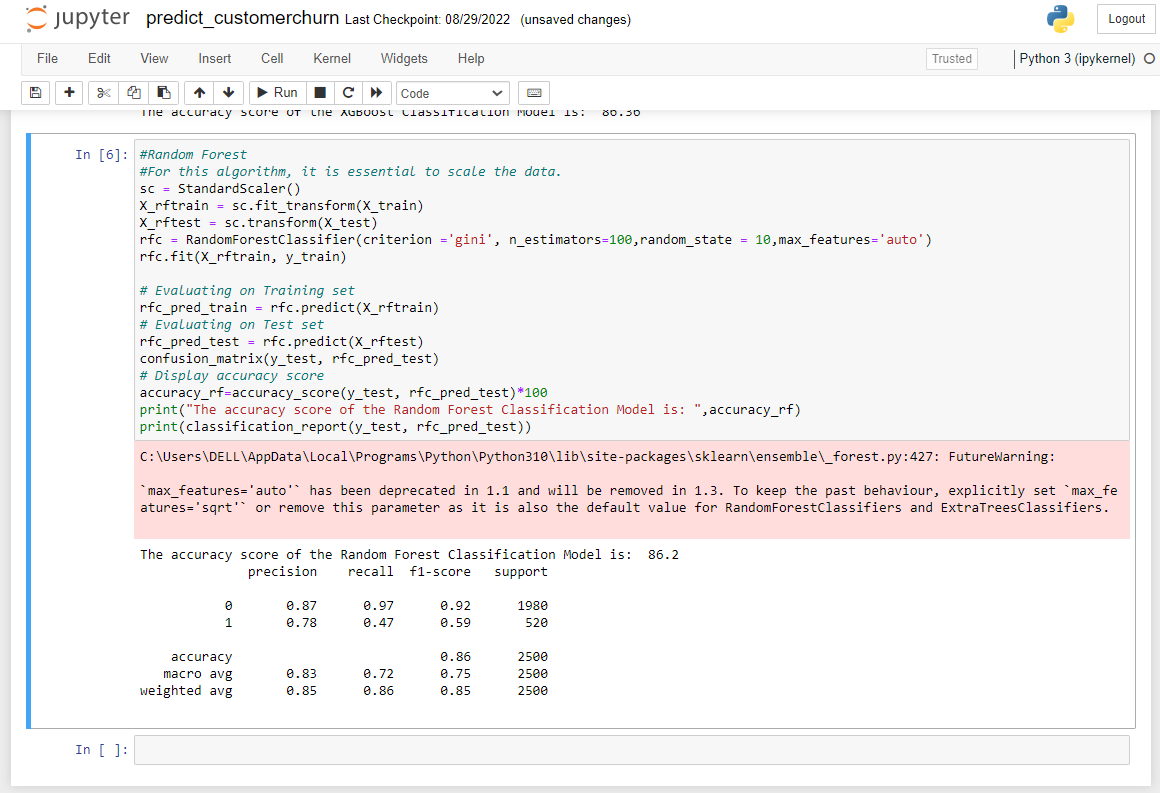
6. Here we are trying the same dataset and trying it on some other algorithms. Then we are passing our testing and training dataset to the algorithm to it. Also, we are using Standard Scalar for fitting the data. Then we are evaluating it
standard_scalar= StandardScaler()
x_train = standard_scalar.fit_transform(X_train)#creating the xtrain
x_test = standard_scalar.transform(X_test)#creating the xtest
random_forest= RandomForestClassifier(criterion ='gini', n_estimators=100,random_state = 10)#creating the model using sklearn
random_forest.fit(x_train, y_train)#fitting the x and y value

pred_value= random_forest.predict(x_train)# Evaluating on Training set

accuracy=accuracy_score(y_test, pred_value)*100 # Display accuracy score
print("The accuracy score is: ",random_forest)
Summary
In this Machine Learning project, we did customer churn analysis. For this project, we have used Random Forest Classifier, xgboost. We hope you have learned something new in this project.


