Customer Segmentation using Machine Learning
With this Machine Learning Project, we are going to do customer segmentation on data. This data is from a mall. We are going to divide its customers into different groups. This is a very important project in data science because you will be always analyzing such kinds of data and dividing your customers into groups. For this project, we are going to use KMeans clustering algorithm.
So, let’s start with the project.
Customer Segmentation
Today, many businesses are going online and therefore online marketing is essential to retain customers. However, considering all customers as equal and targeting them all with similar marketing strategies is not an efficient way, since it also annoys the customers by neglecting their individuality, so customer segmentation has become very popular and has also become a viable solution.
The goal of customer segmentation is to divide the company’s customers based on their demographic characteristics (age, gender, marital status) and their behavior characteristics (types of products ordered, annual income). It’s a better approach for customer segmentation to focus on behavioral aspects rather than demographic characteristics since they do not emphasize individuality of customers.
The Model Architecture
It is often used in marketing to create customer segments and understand the behaviors of these segments. The K-means clustering algorithm provides insight into formats and differences in a database. The Python environment offers a great environment for building assemblies
With K-means Clustering, we are given data points with their data sets and features, and the mechanism is to classify their data into clusters according to their similarities. K clusters are formed based on the similarity of the data. A Euclidean distance measurement method is used by KMeans to calculate similarity.
- This is step one. A random initialization of k points is done in the first step.
- Using K-means, each data point is classified according to its nearest mean, and its coordinates are rewritten according to the mean.
- Iteration is continuing up till all data points are classified.
Project Prerequisites
The required modules for this project are :
- Pandas – pip install pandas
- Numpy- pip install numpy
- Seaborn – pip install seaborn
- Matplotlib – pip install matplotlib
Customer Segmentation Project
The dataset for this project is a csv file. This file contains four columns which are customer_id, genre, age, annual_income, and spending_score. This data is from customers of a mall. We are going to analyze this data and divide its customers into segments. Please download customer segmentation machine learning project along with the dataset from the following link: Customer Segmentation Project
Steps to Implement Customer Segmentation Project
1. Importing all the modules to be used in the project.
import numpy as np
import pandas as pd
import matplotlib.pyplot as plt
import seaborn as sns

import numpy as np
import matplotlib.pyplot as plt
%matplotlib inline
from tensorflow.keras.layers import Input,Conv2D,MaxPooling2D,Dropout,Flatten,Dense,Activation,BatchNormalization,add
from tensorflow.keras.models  import Model,Sequential
from tensorflow.keras.preprocessing.image import ImageDataGenerator
from tensorflow.keras.utils import plot_model
from tensorflow.keras.applications.vgg16 import VGG16,preprocess_input

import os
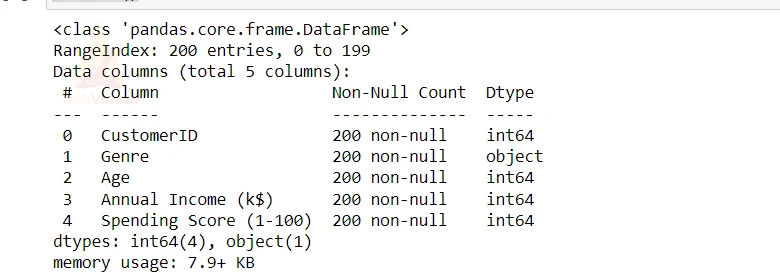
2. Here we are reading our dataset.
df = pd.read_csv('Mall_Customers.csv')

df.info()
3. Here we are defining our KMeans Model and we are fitting our training data.
X = df.iloc[:, [3,4]].values

from sklearn.cluster import KMeans
wcss=[]
for i in range(1,11):
    kmeans = KMeans(n_clusters= i, init='k-means++', random_state=0)
    kmeans.fit(X)
    wcss.append(kmeans.inertia_)
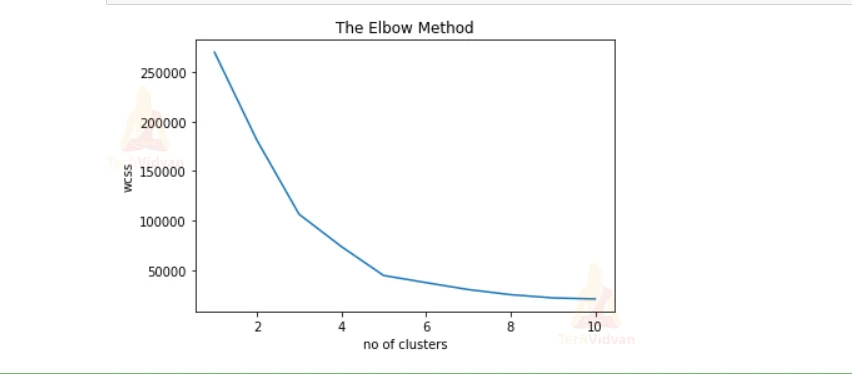
4. Here we are plotting the result.
plt.plot(range(1,11), wcss)
plt.title('The Elbow Method')
plt.xlabel('no of clusters')
plt.ylabel('wcss')

plt.show()
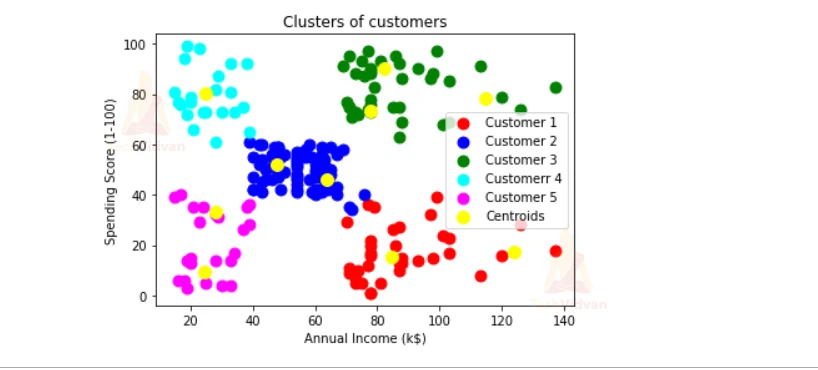
5. Here we are passing the testing data and we are predicting the result and we are plotting the data as clusters of the points.
kmeansmodel = KMeans(n_clusters= 5, init='k-means++', random_state=0)
y_kmeans= kmeansmodel.fit_predict(X)

plt.scatter(X[y_kmeans == 0, 0], X[y_kmeans == 0, 1], s = 80, c = 'red', label = 'Customer 1')
plt.scatter(X[y_kmeans == 1, 0], X[y_kmeans == 1, 1], s = 80, c = 'blue', label = 'Customer 2')
plt.scatter(X[y_kmeans == 2, 0], X[y_kmeans == 2, 1], s = 80, c = 'green', label = 'Customer 3')
plt.scatter(X[y_kmeans == 3, 0], X[y_kmeans == 3, 1], s = 80, c = 'cyan', label = 'Customerr 4')
plt.scatter(X[y_kmeans == 4, 0], X[y_kmeans == 4, 1], s = 80, c = 'magenta', label = 'Customer 5')
plt.scatter(kmeans.cluster_centers_[:, 0], kmeans.cluster_centers_[:, 1], s = 100, c = 'yellow', label = 'Centroids')

plt.title('Clusters of customers')

plt.xlabel('Annual Income (k$)')
plt.ylabel('Spending Score (1-100)')

plt.legend()

plt.show()
Summary
In this Machine Learning project, we learned how to implement customer segmentation. This is a really important project for data science. We are going to analyze such kinds of data a lot of times in data science. For segments, we have used kmeans clustering algorithm.