Data Reshaping in R – Popular Functions to Organise Data
In this TechVidvan tutorial, discover why data reshaping is required in R and learn how to use different functions in R to do this.
For an analysis project, the gathered data is messy and unstructured most of the time. It is collected from different sources, has different variables, and has irregular formats.
With this tutorial, learn how to change the gathered data and conform it to our desired format in R. We will take a look at the functions in R that allow us to do this and much more. So, get ready for the ride!
What is Data Reshaping in R?
Before we can perform any kind of analysis, we first need to shape the gathered data into a regular and processable format. We need to ensure that all of the data fits into proper variables.
We also need to take care of missing values and put placeholders in their place that our analysis tools can understand.
This is the first step in any analysis project. We call this process as data reshaping.
Now let’s learn popular functions used for data reshaping in R.
The cbind(), rbind(), and t() Functions
There are many functions in R that allow us to manipulate data objects in many ways.
cbind(), rbind(), and t() are the most commonly used functions for data reshaping. We will be going through them one-by-one:
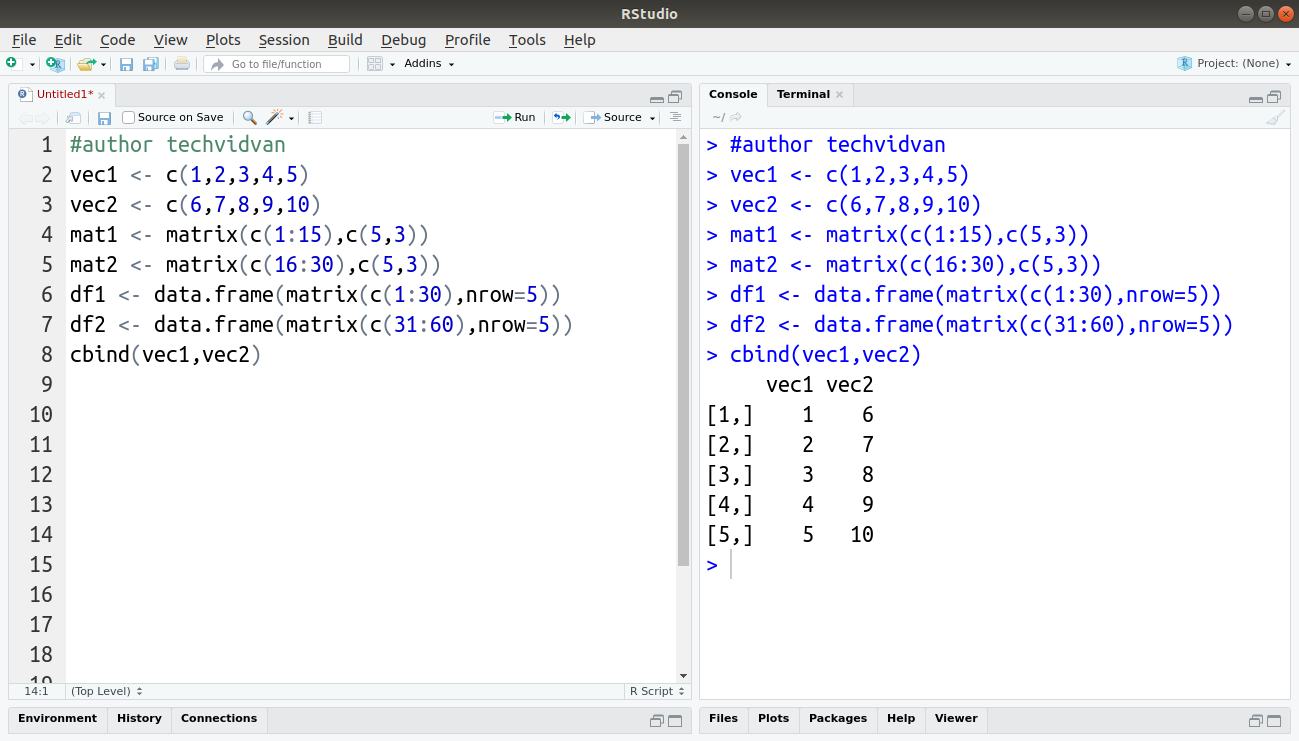
1. cbind(): The cbind() function allows us to join objects as column. We can combine matrices, data-frames, vectors or any combination of these.
Code:
vec1 <- c(1,2,3,4,5)
vec2 <- c(6,7,8,9,10)
mat1 <- matrix(c(1:15),c(5,3))
mat2 <- matrix(c(16:30),c(5,3))
df1 <- data.frame(matrix(c(1:30),nrow=5))
df2 <- data.frame(matrix(c(31:60),nrow=5))
cbind(vec1,vec2)
Output:
Code:
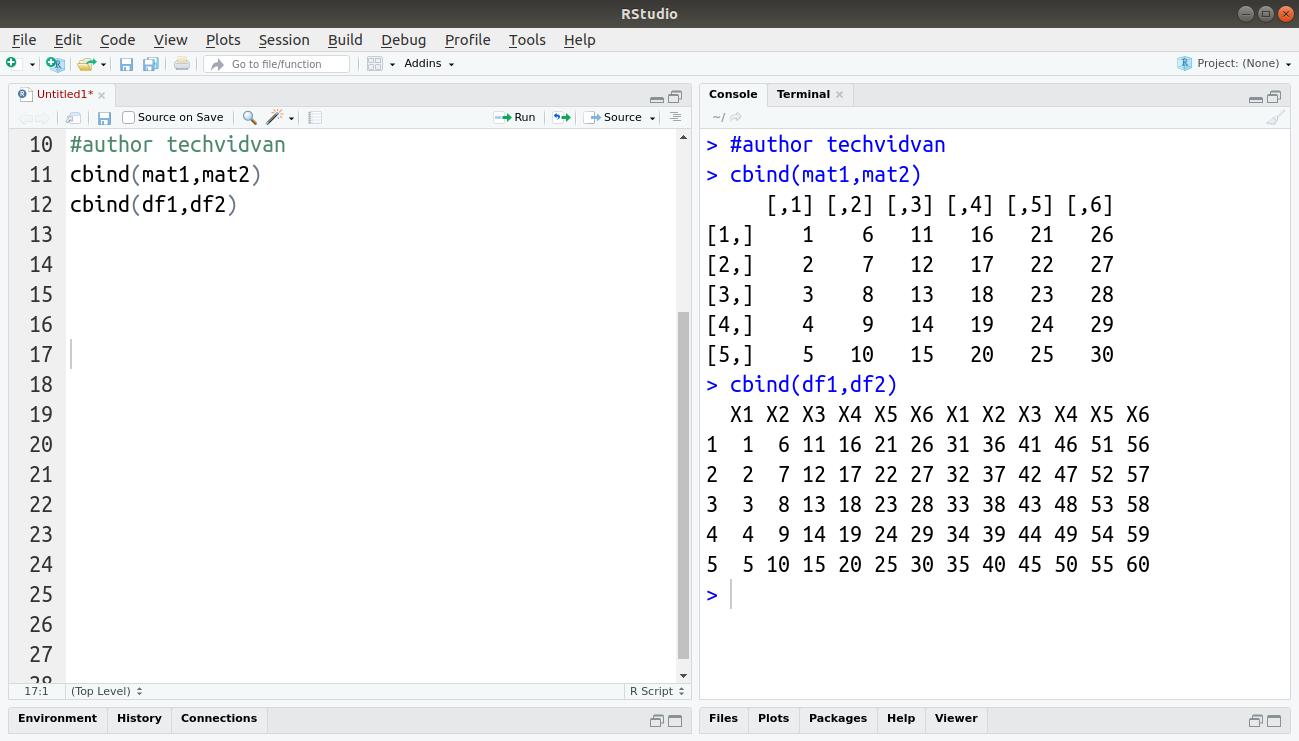
cbind(mat1,mat2)
Code:
cbind(df1,df2)
Output:
Code:
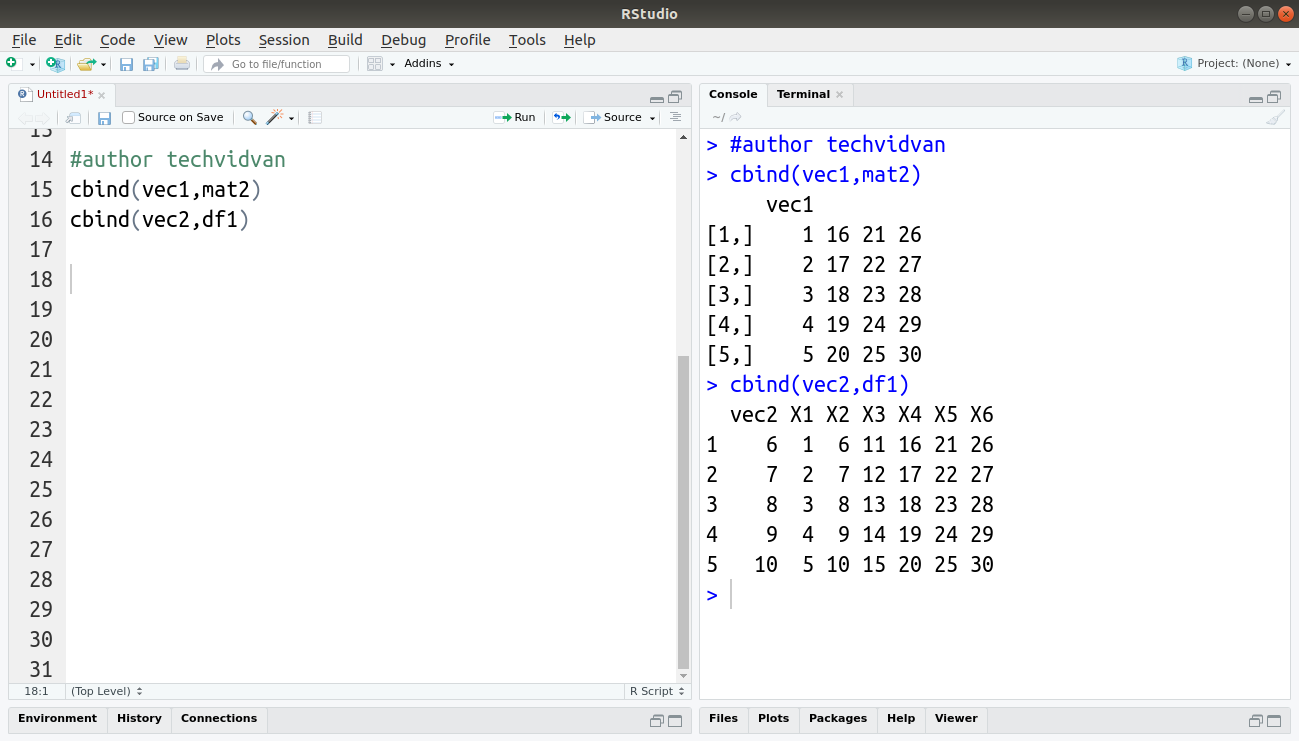
cbind(vec1,mat2)
Code:
cbind(vec2,df1)
Output:
Code:
cbind(mat1,df2)
Output:

Note: The number of rows should be the same for the cbind() function to work.
Wait! before proceeding ahead get a clear understanding of user-defined functions in R.
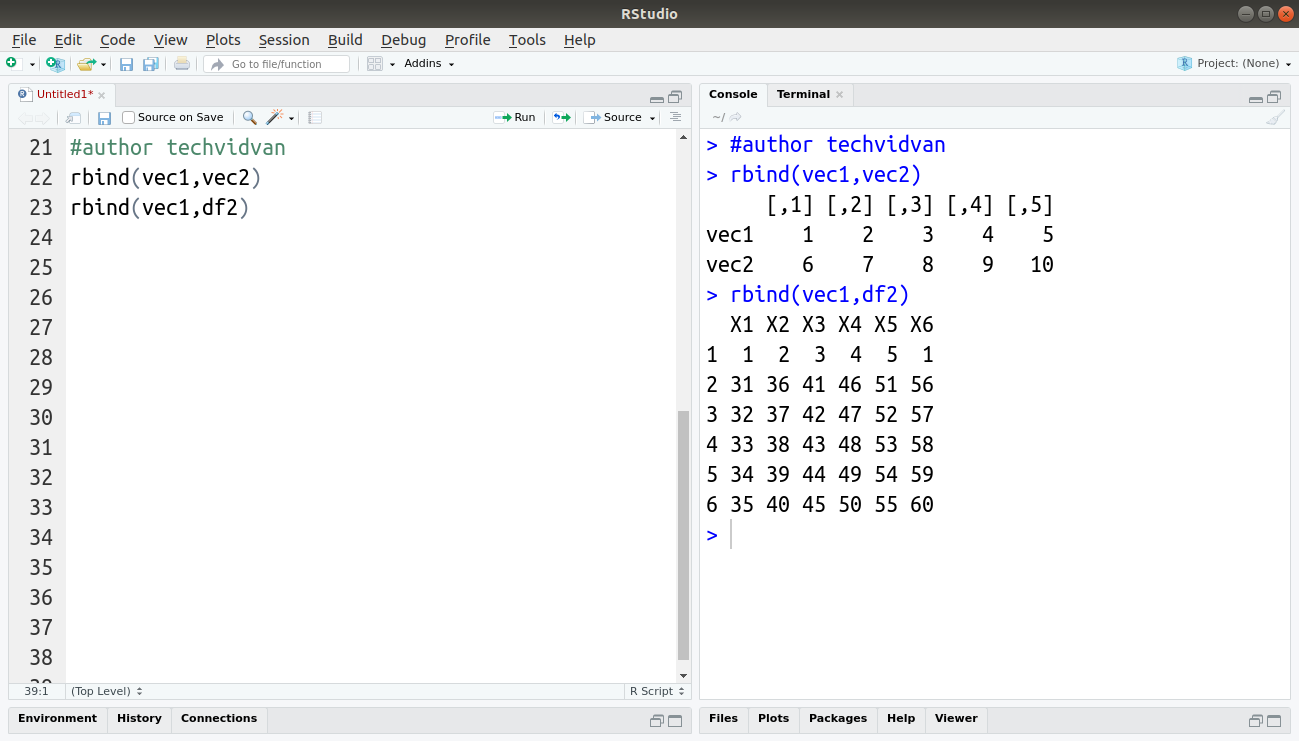
2. rbind(): The rbind() function allows us to join objects as rows.
Code:
rbind(vec1,vec2)
Code:
rbind(vec1,df2)
Output:
Note: The number of columns should be the same for the rbind() function to work.
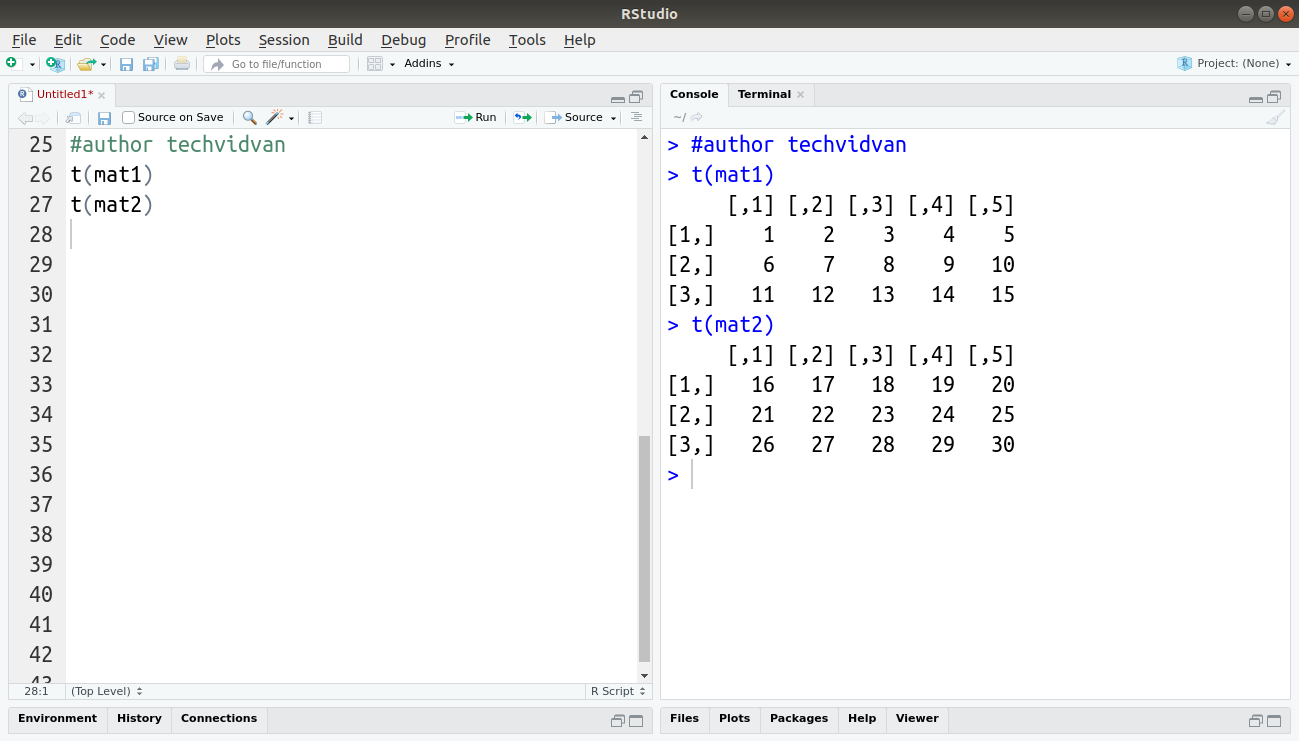
3. t(): Thet() function transposes a matrix that is it turns the rows into columns and columns into rows.
Code:
t(mat1)
Code:
t(mat2)
Output:
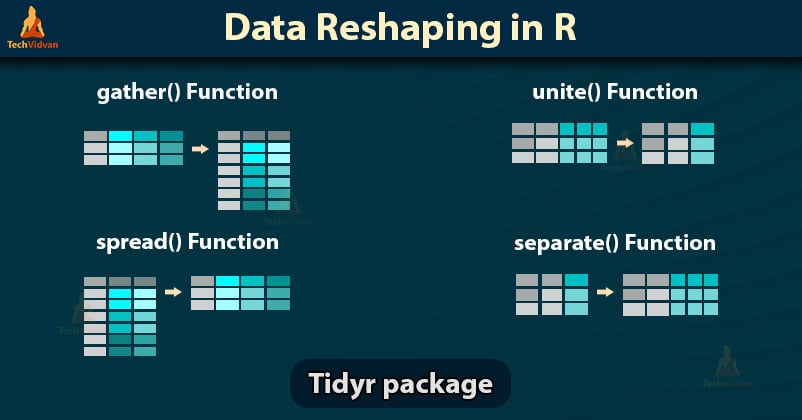
The Tidyr package
The tidyr package is the most commonly used R package for data reshaping in R. tidyr helps you tidy your data.
It allows you to convert it into the desired format and make it easier to process and analyze. Tidyr simplifies the process of data reshaping.
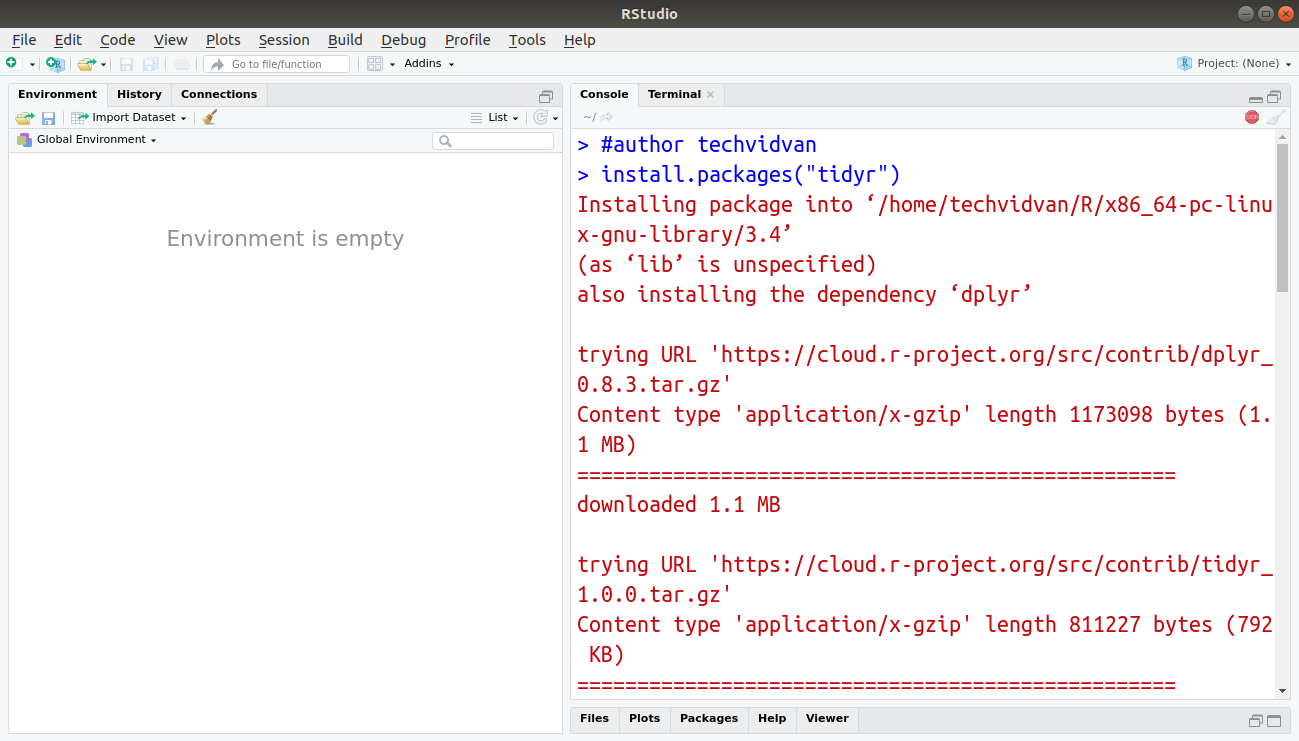
To install tidyr, use the following command:
install.packages("tidyr")
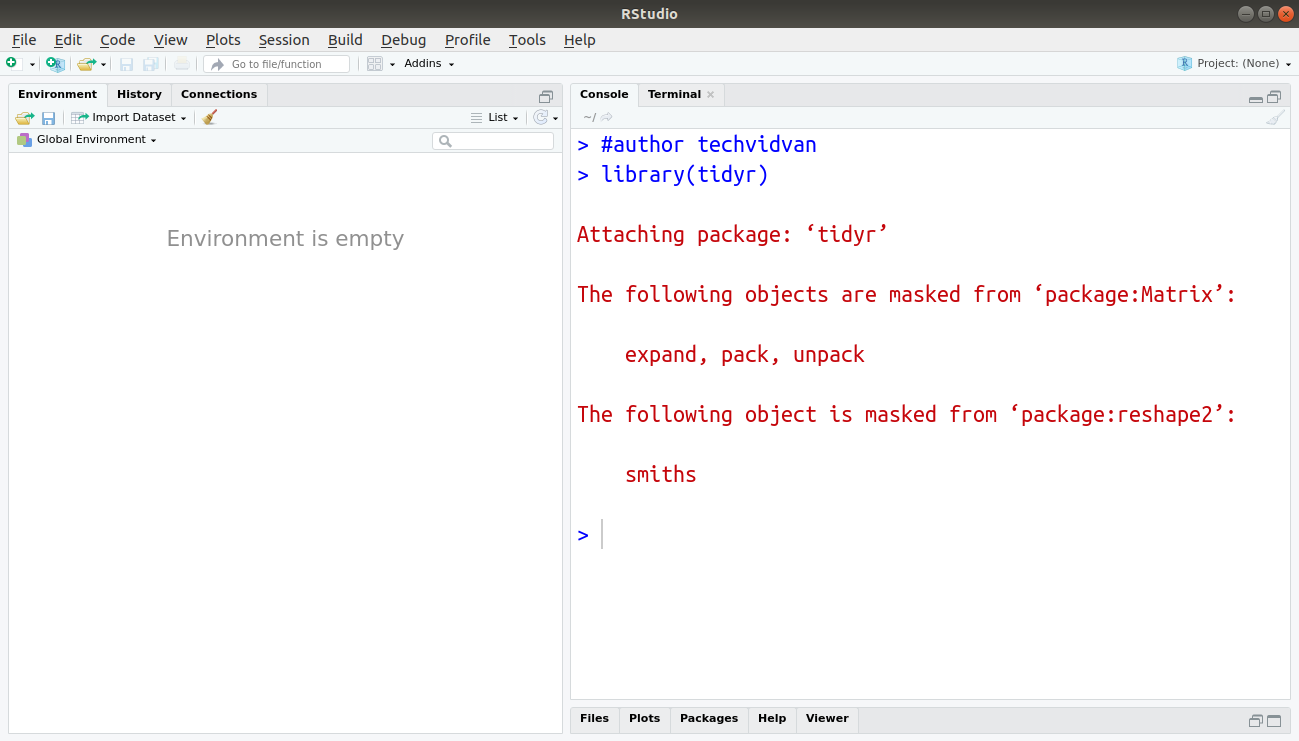
Once installed, include it into your current R session by using the library() command:
library(tidyr)
These functions of tidyr are very useful in data reshaping and keeping your data tidy.
- gather()
- spread()
- unite()
- separate()
Let’s look at these functions and their usage:
1. gather() Function
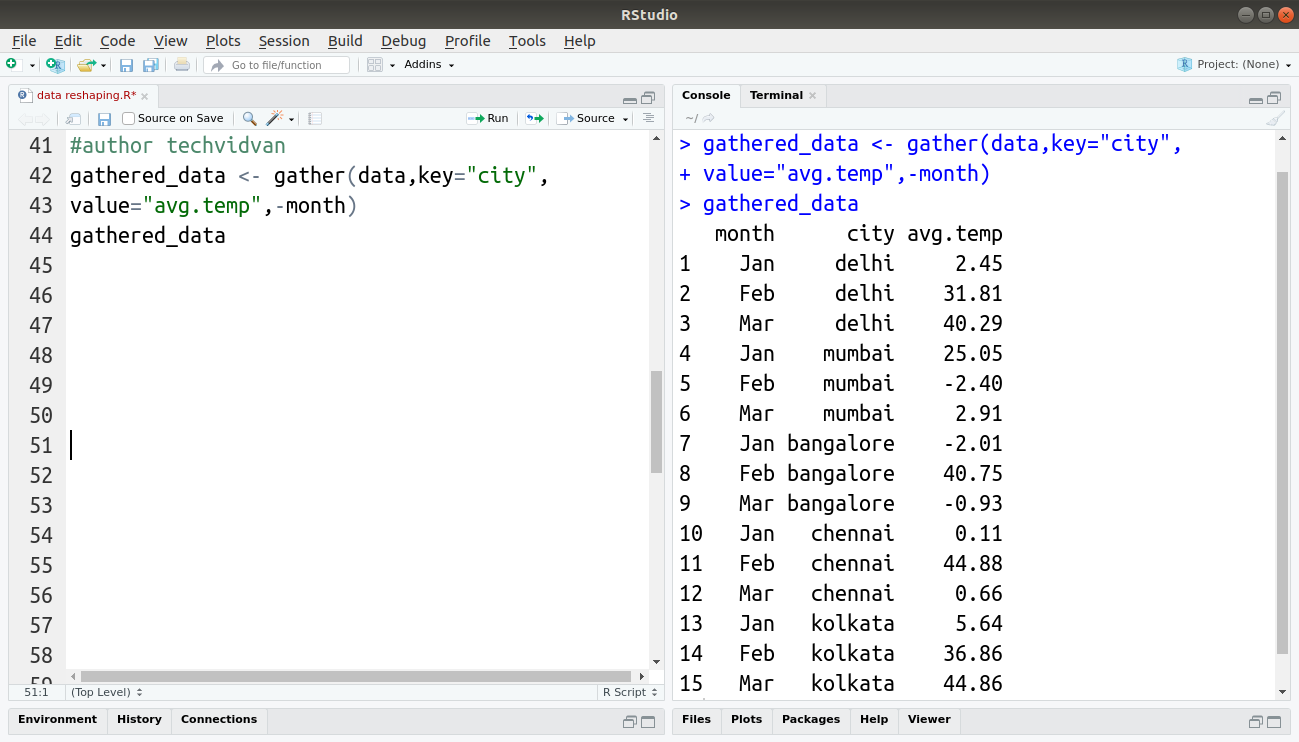
The gather() function helps us in reshaping wide-format data-frames to long-format.
Sometimes, datasets have attributes of common concern spread across different columns. This creates unnecessary variables. Such a dataset is said to be in the wide-format.
It would be more efficient to stack similar attributes together and turning the dataset into long-format. The gather() function allows us to do that.
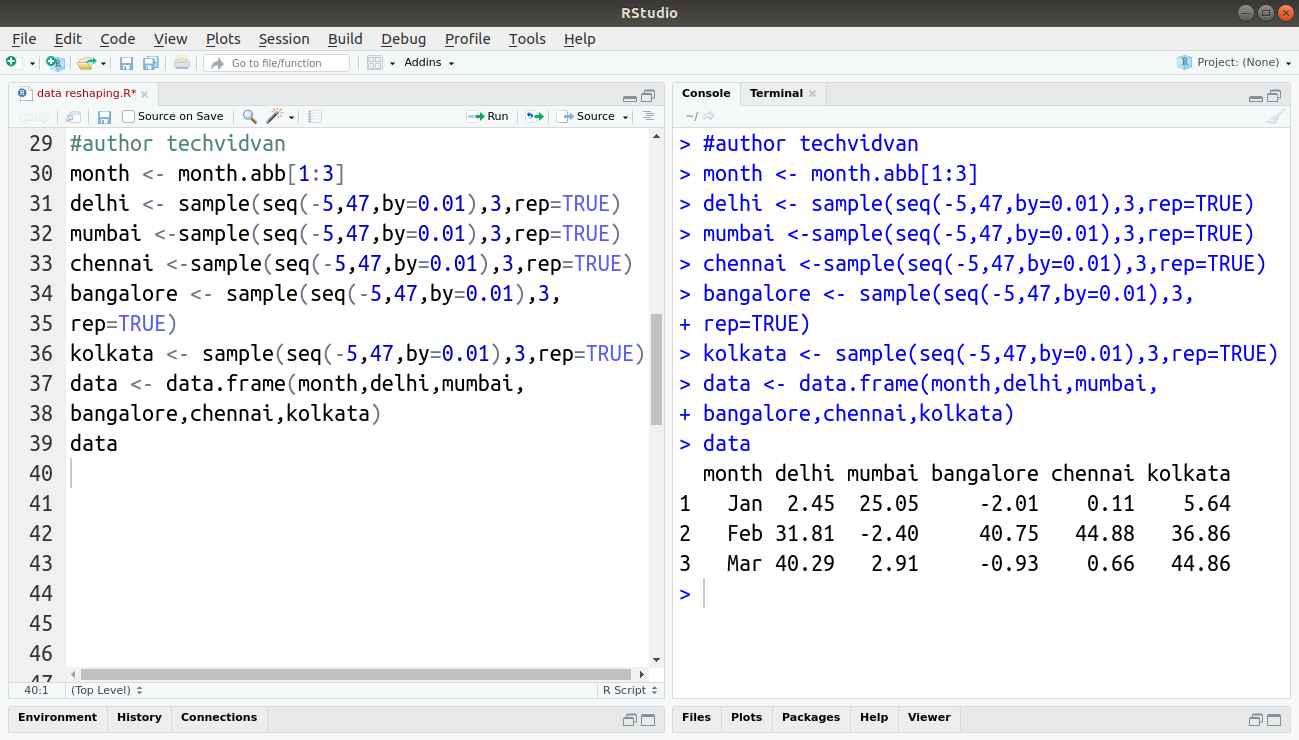
Code:
month <- month.abb[1:3]
delhi <- sample(seq(-5,47,by=0.01),3,rep=TRUE)
mumbai <-sample(seq(-5,47,by=0.01),3,rep=TRUE)
chennai <-sample(seq(-5,47,by=0.01),3,rep=TRUE)
bangalore <- sample(seq(-5,47,by=0.01),3,rep=TRUE)
kolkata <- sample(seq(-5,47,by=0.01),3,rep=TRUE)
data <- data.frame(month,delhi,mumbai,bangalore,chennai,kolkata)
data
Output:
Code:
gathered_data <- gather(data,key="city",value="avg.temp",-month)
gathered_data
Output:
2. spread() Function
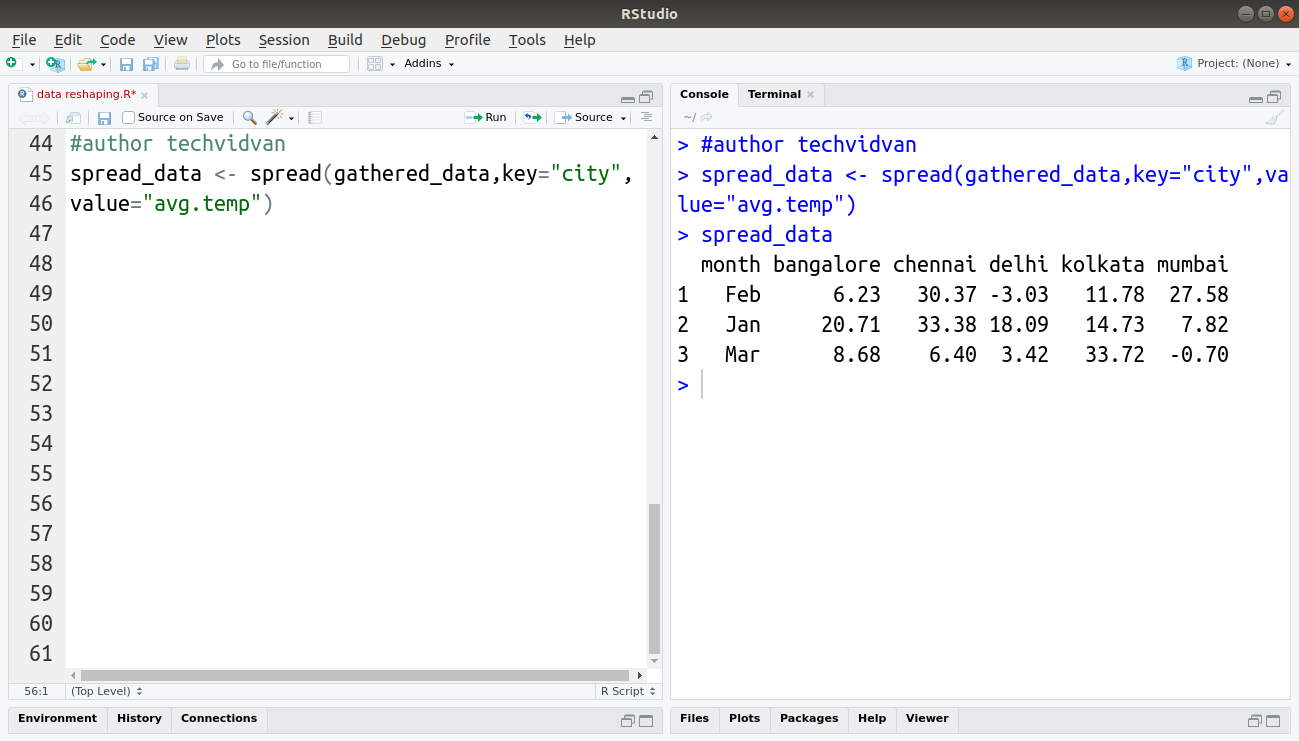
The spread() function is the complement to the gather() function. It spreads long-format data-frames to wide-format.
Code:
spread_data <- spread(gathered_data,key="city",value="avg.temp")
Output:
3. unite() Function
Take a look at the following dataset:
| S.no | Month | Year | Temp. |
| 1 | jan | 2018 | 4.64 |
| 2 | feb | 2018 | 19.68 |
| 3 | jan | 2019 | 2.56 |
| 4 | mar | 2019 | 36.74 |
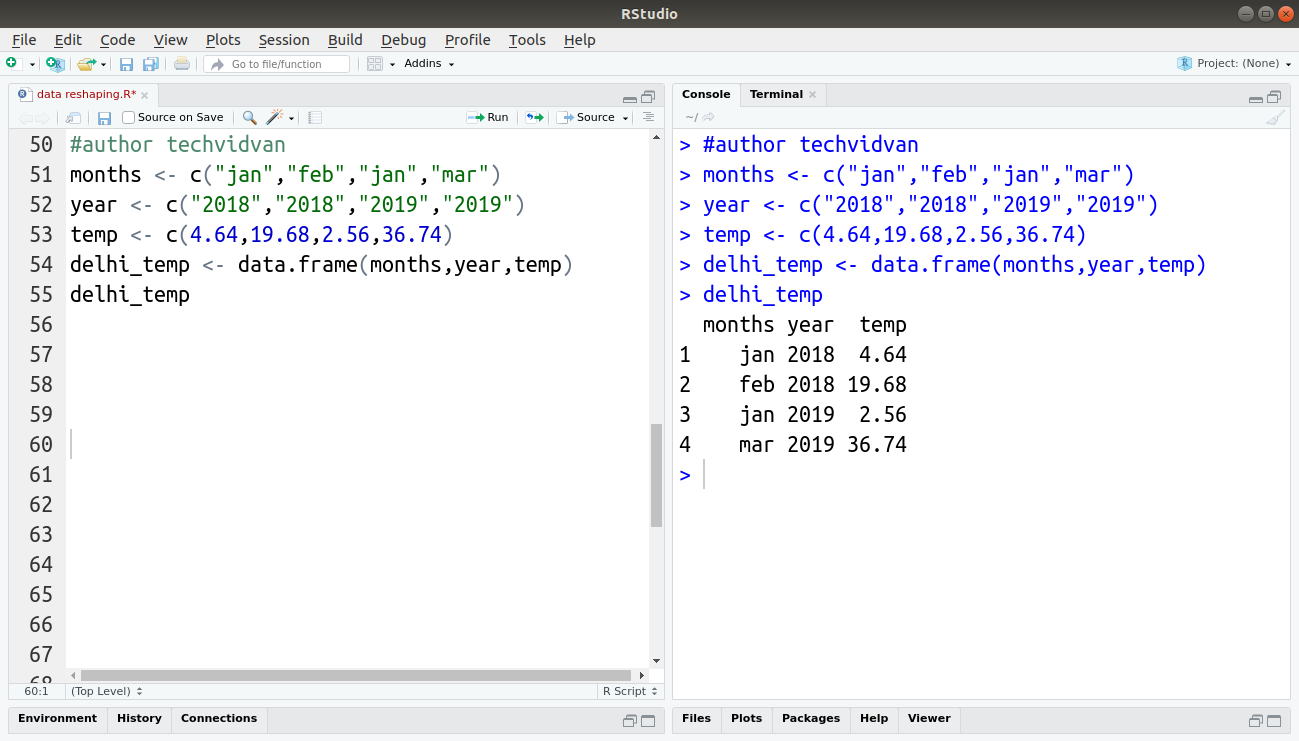
In the dataset, the month and year have separate columns. It looks inefficient, doesn’t it?
The two variables month and year can be in the same column without affecting the information conveyed by the data. This is exactly what the unite() function does.
Code:
months <- c("jan","feb","jan","mar")
year <- c("2018","2018","2019","2019")
temp <- c(4.64,19.68,2.56,36.74)
delhi_temp <- data.frame(months,year,temp)
delhi_temp
Output:
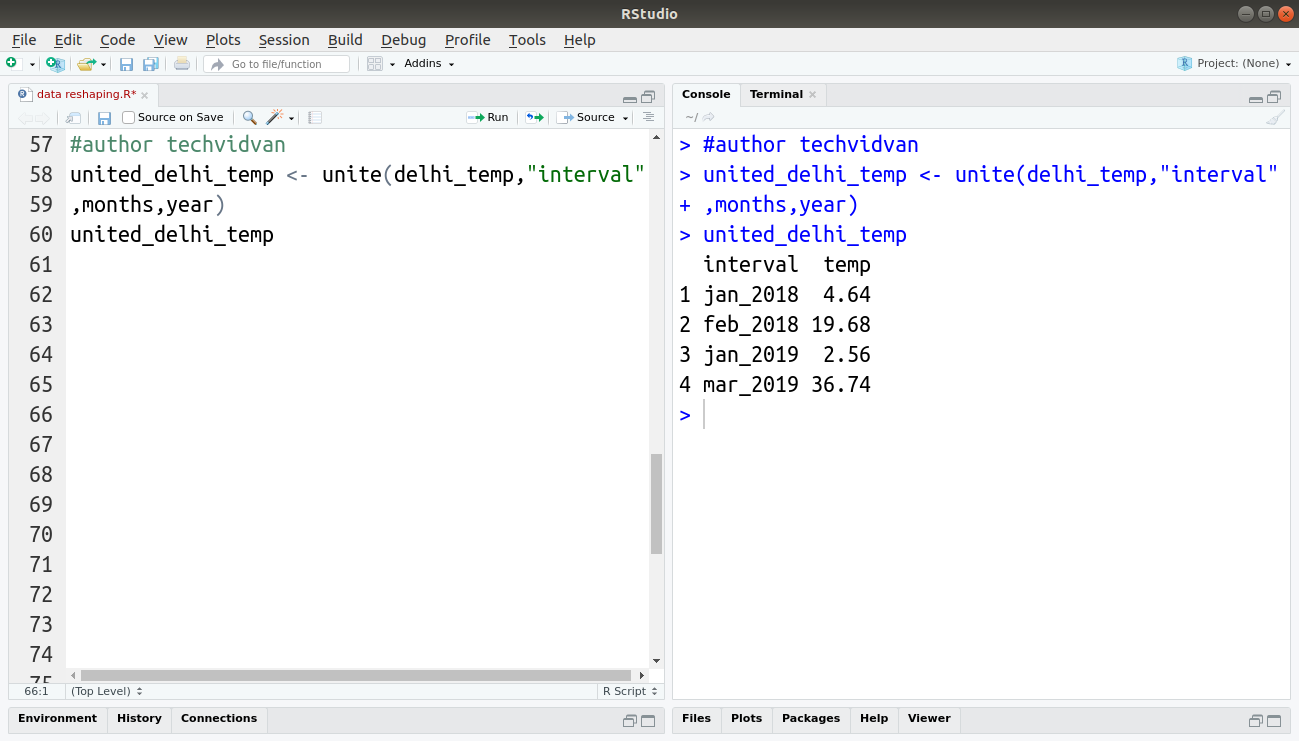
Code:
united_delhi_temp <- unite(delhi_temp,"interval",months,year)
united_delhi_temp
Output:
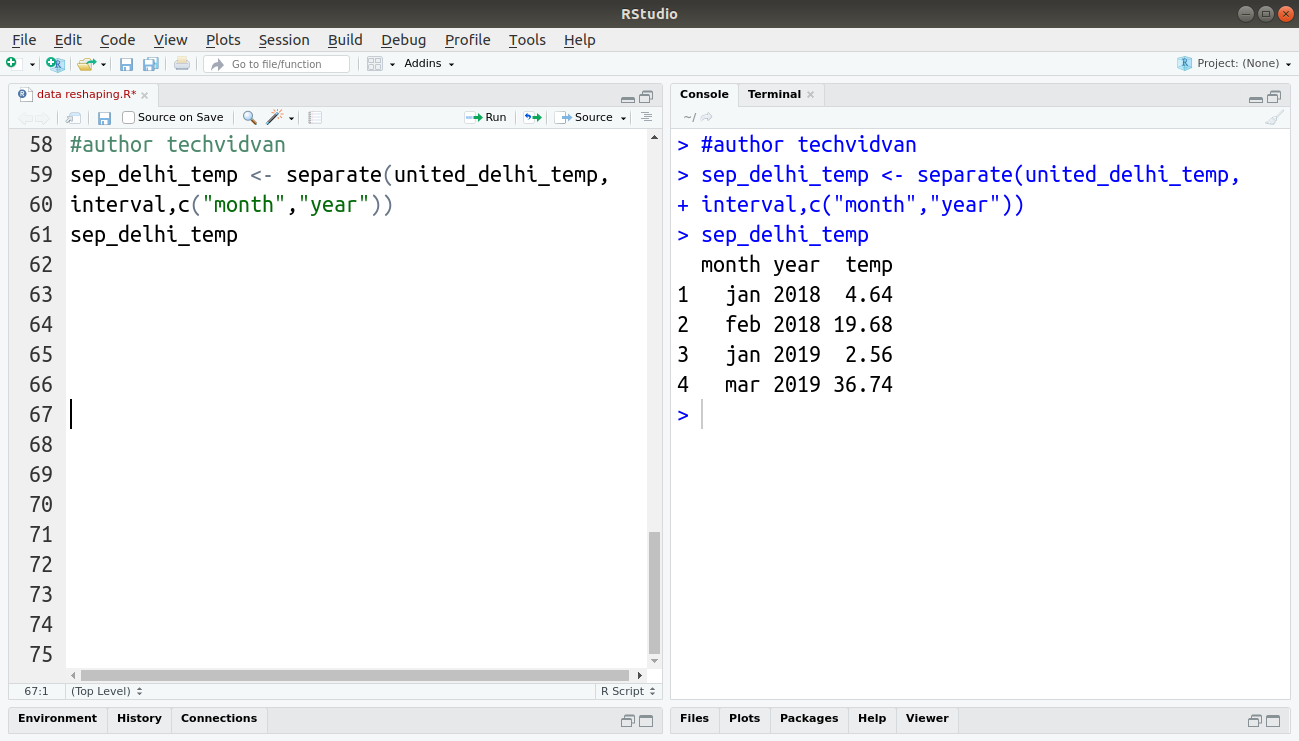
4. separate() Function
The separate() function is the complement to the unite() function. It separates values into separate columns.
Code:
sep_delhi_temp <- separate(united_delhi_temp,
interval,c("month","year"))
sep_delhi_temp
Output:
The Reshape2 Package
Reshape2 is another R package that is used for data reshaping. Reshape2 can be considered as an older version of the tidyr package.
The development of the reshape2 package has stopped. The most commonly used reshape2 functions are the melt() and merge() functions.
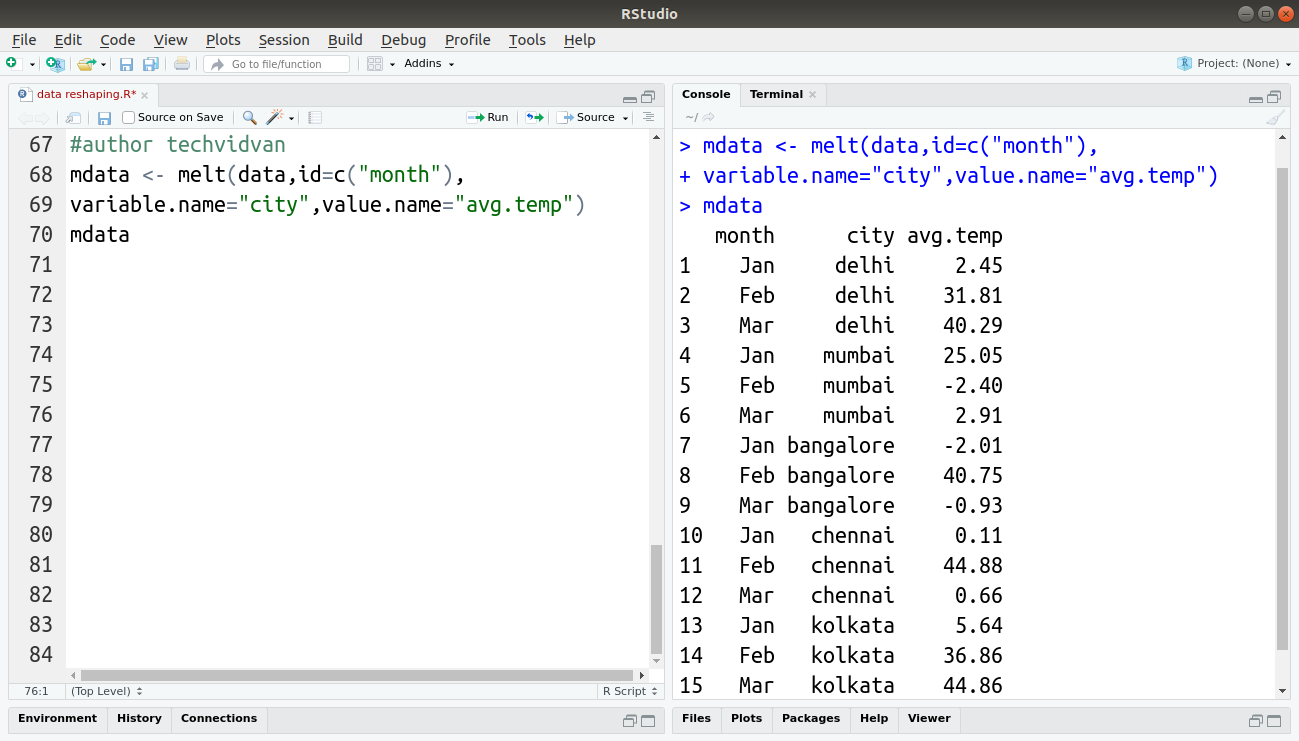
1. melt() Function
The melt() function is very similar to the gather() function from the tidyr package. It melts the input data frame and converts wide-format data into long-format. For example:
Code:
mdata <- melt(data,id=c("month"),variable.name="city", value.name="avg.temp")
mdata
Output:
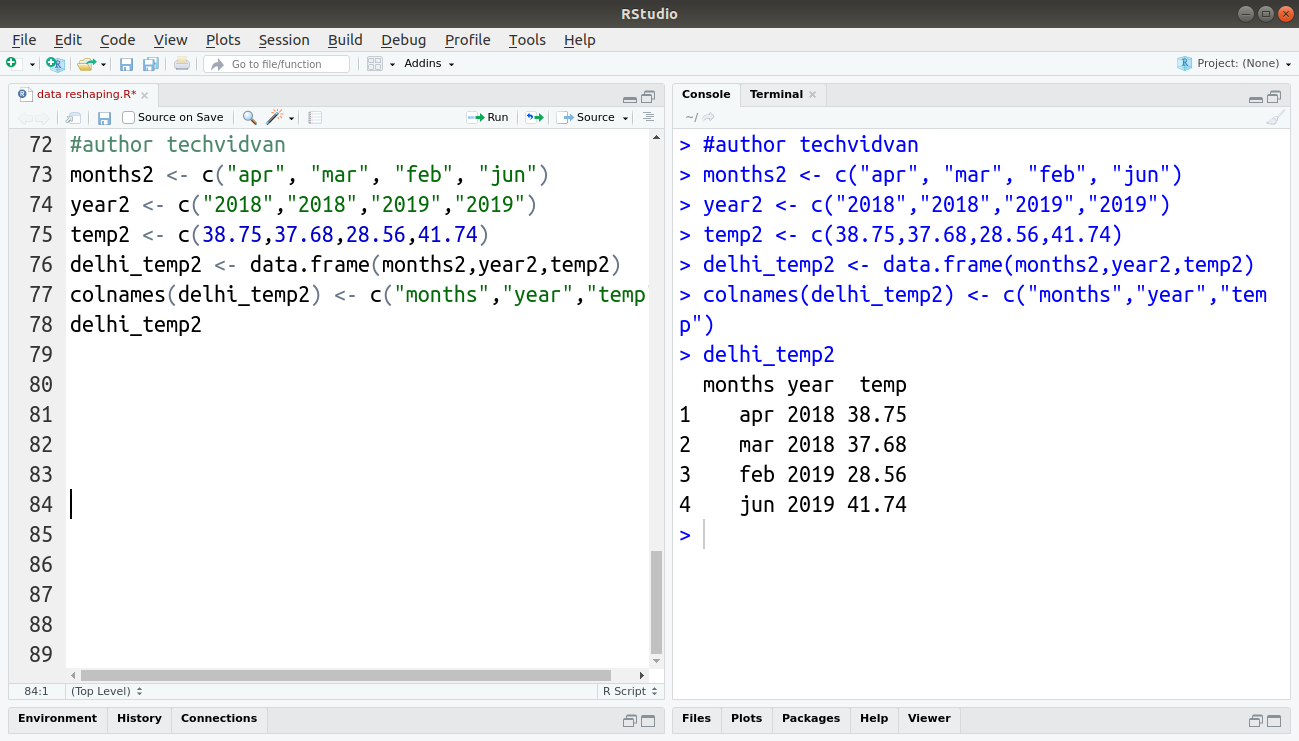
2. merge() Function
The merge() function can merge data frames. The function merges the input data frames horizontally, therefore, the data frames must have the same variable that is column names. For example:
Code:
months2 <- c("apr", "mar", "feb", "jun")
year2 <- c("2018","2018","2019","2019")
temp2 <- c(38.75,37.68,28.56,41.74)
delhi_temp2 <- data.frame(months2,year2,temp2)
colnames(delhi_temp2) <- c("months","year","temp")
delhi_temp2
Output:
Code:
merge_delhi_temp <- merge(delhi_temp,delhi_temp2,by="year")
merge_delhi_temp
Output:

Summary
Data reshaping is the first step of any data analysis project. It is also called data formatting and data cleaning.
In this article, we looked at the functions in base R that allow us to reshape and transform our data.
We also looked at the most popular data processing and transformation package, the tidyr package. The tidyr package is a part of the tidyverse collection of R packages. It is a must-have for beginner, intermediate and advanced R programmers.
Still, have some doubts about the data reshaping in R? Ask us and our TechVidvan experts will be happy to help you.
Keep Visiting ?