Contingency tables in R – Learn to represent data in a condensed form
Contingency tables are very useful to condense a large number of observations into smaller easier to maintain tables. In this R tutorial, we are going to learn about contingency tables and how to create them. We will learn about complex/flat tables, cross-tabulation, and also about recovering original data from the contingency tables.
As you can see, this tutorial is going to be packed to the brim. So, let’s not waste any more time, and get started.
What are Contingency Tables?
A contingency table shows the distribution of a variable in the rows and another in its columns. Contingency tables are not only useful for condensing data, but they also show the relations between variables. They are a way of summarizing categorical variables.
A contingency table that deals with a single table are called a complex or a flat contingency table.
Contingency Tables in R
The table() function can be used in R to create a contingency table. The table function is one of the most versatile functions in R. It can take any data structure as an argument and turn it into a table. Let us take a look at the example below:
Code:
ct1 <- table(mtcars$gear, mtcars$cyl, dnn=c("gears","cylinders"))
ct1
Output:
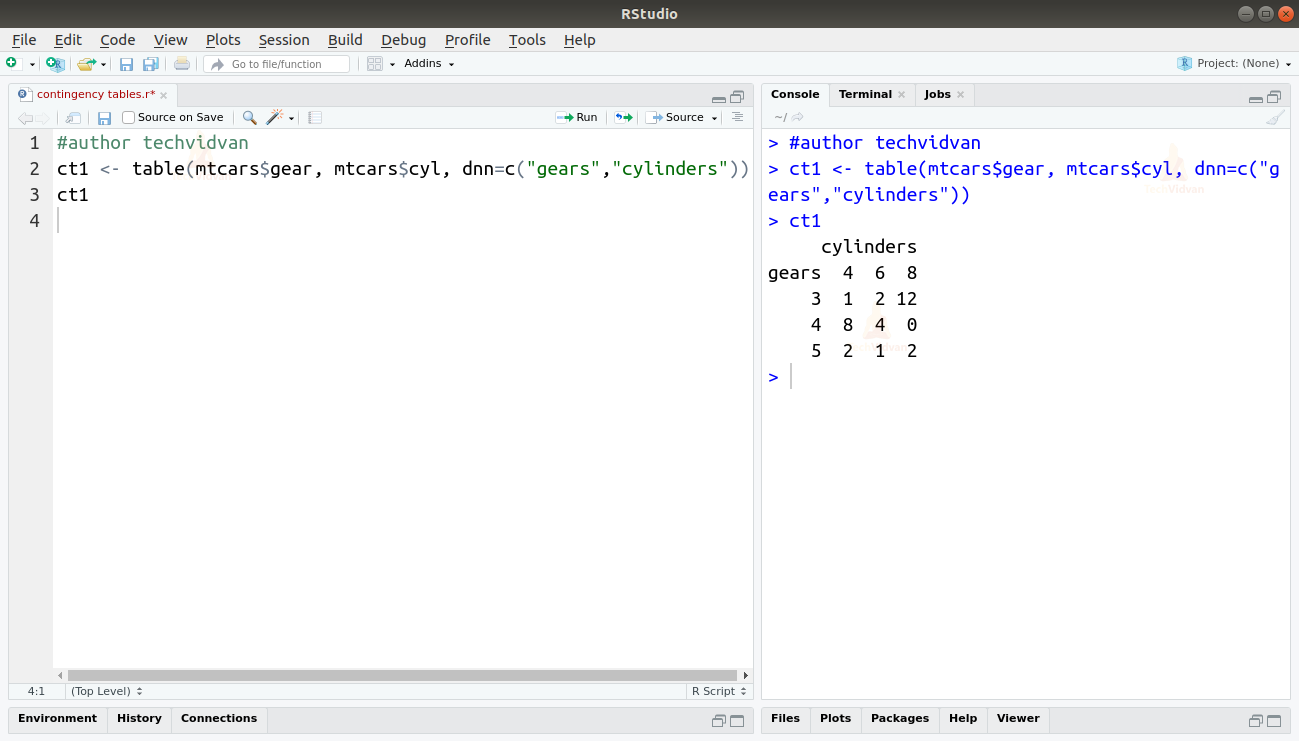
In the above example, we take two categorical variables from the mtcars datasets. These variables are the number of gears and the number of cylinders inside the cars. The resultant table contains the number of gears as rows and the number of cylinders as columns.
Calculating the row totals of a contingency table in R
We can calculate the totals of each of the rows in a contingency table by using the margin.table() function. Let’s take a look at that with an example:
Code:
margin.table(ct1, margin = 1)
Output:

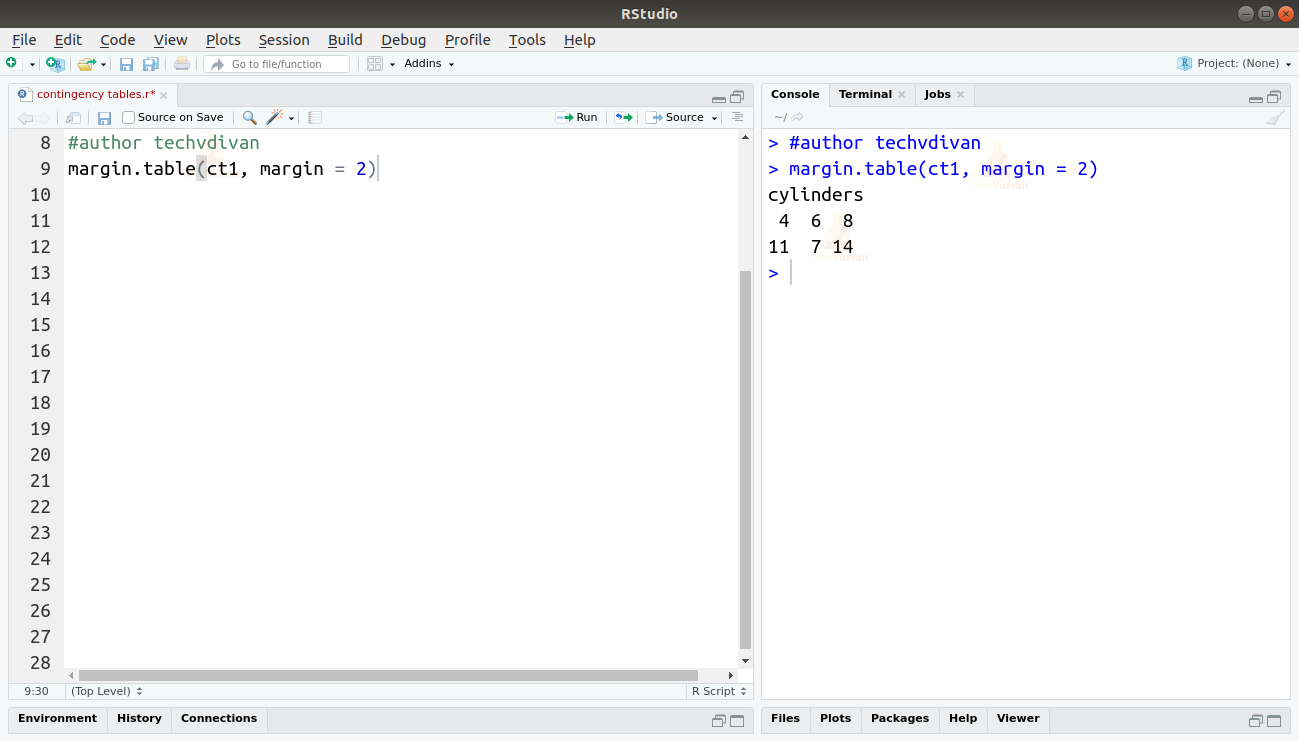
Calculating the column totals of a contingency table in R
We can also calculate the totals of each of the columns in a contingency table similarly, by using the margin.table() function. All we have to change is the margin argument to 2. Here is an example of this.
Code:
margin.table(ct1, margin = 2)
Output:
The addmargins function
The addmargins() function is another way to find the sum totals of the rows and columns of a contingency table. This function finds the totals of all the rows as well as columns of the input contingency table. Let us take a look at an example of this function as well.
Code:
addmargins(ct1)
Output:

Proportional contingency tables in R
Using the prop.tables() function, we can find the proportional weight of each value in a contingency table. This is demonstrated in the example below:
Code:
prop.table(ct1)
Output:

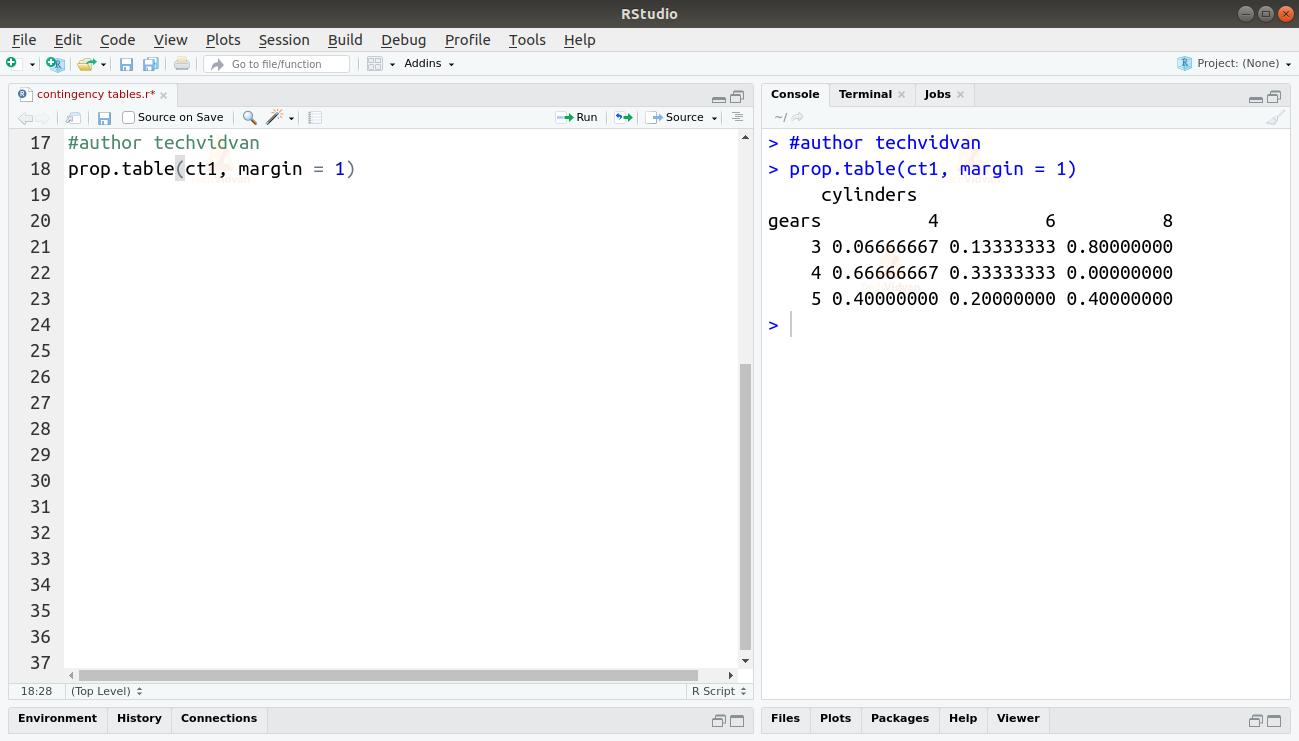
Contingency tables in R with proportional rows
By using margin = 1 as an argument in the prop.table() function, we can also find the row proportions in a contingency table.
Code:
prop.table(ct1, margin = 1)
Output:
Contingency tables in R with proportional columns
We can find the column proportions in a contingency table, by using margin = 2 in the arguments of the prop.table() function.
Code:
prop.table(ct1, margin = 2)
Output:

Creating Flat Contingency tables in R
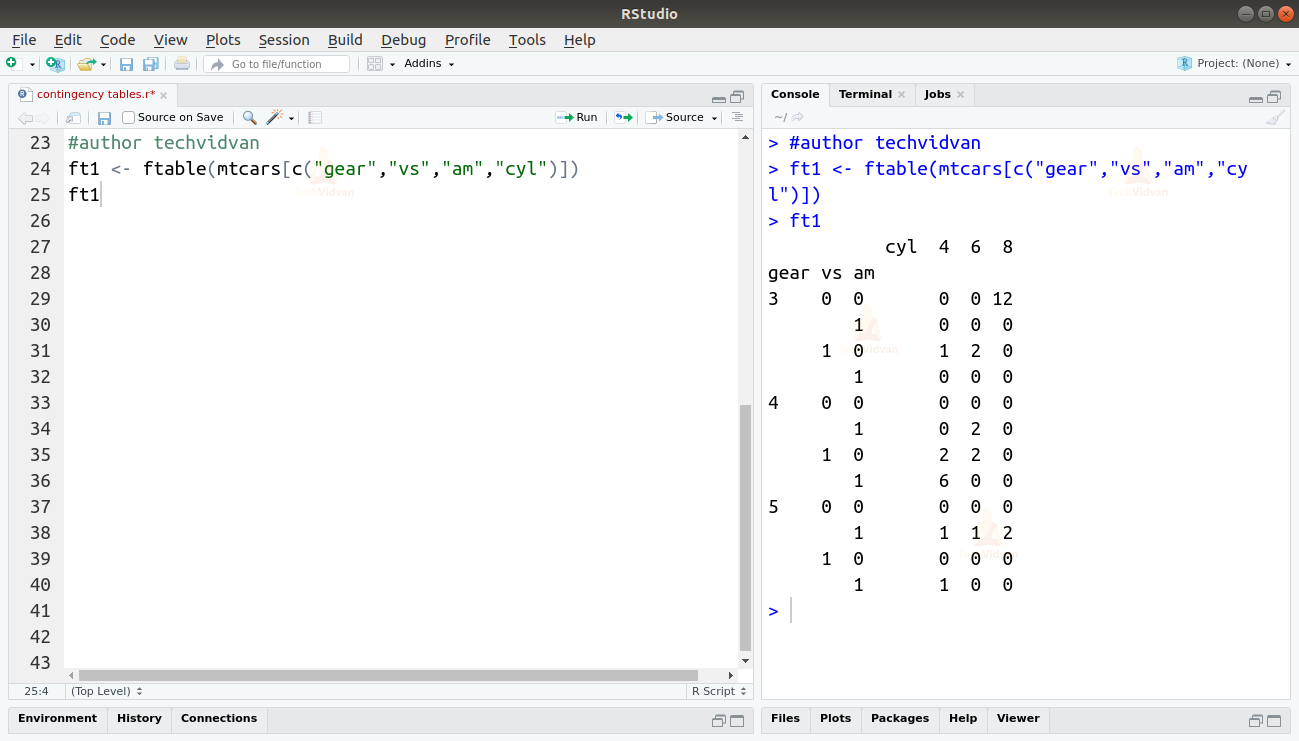
We can create Flat or complex contingency tables in R using the ftable() function. Let us take a look at this with the help of the following example.
Code:
ft1 <- ftable(mtcars[c("gear","vs","am","cyl")])
ft1
Output:
Cross Tabulation and The xtabs Function
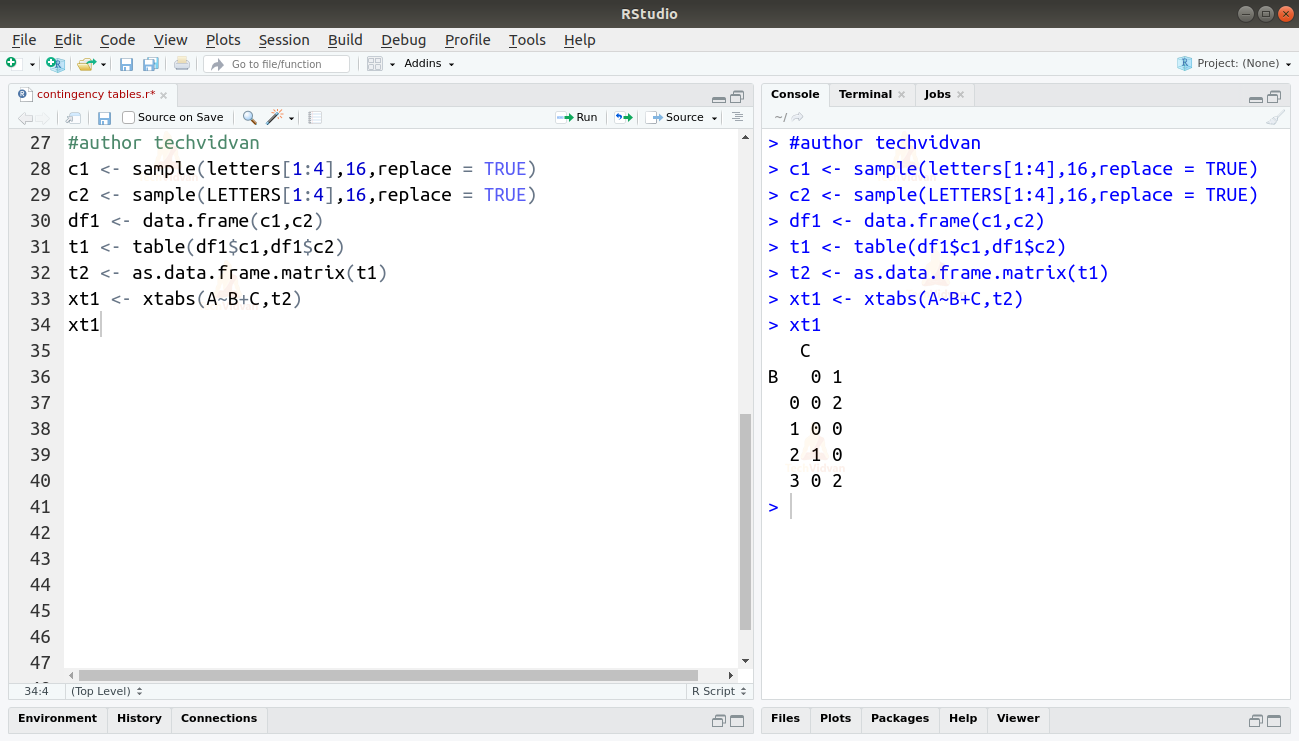
The xtabs() function of R, allows us to create a contingency table using cross-tabulation. The function returns an object that has a class of “table” as well as “xtabs”. Following is an example of the usage of the xtabs function.
Code:
c1 <- sample(letters[1:4],16,replace = TRUE)
c2 <- sample(LETTERS[1:4],16,replace = TRUE)
df1 <- data.frame(c1,c2)
t1 <- table(df1$c1,df1$c2)
t2 <- as.data.frame.matrix(t1)
xt1 <- xtabs(A~B+C,t2)
xt1
Output:
Recovering data from contingency tables in R
The data from the contingency tables created using the xtabs() function can be retrieved by using the as.data.frame() function. The result is a data frame object.
Code:
df2 <- as.data.frame(xt1)
df2
Output:

Summary
Contingency tables are an efficient way to summarize data and find relations and dependencies between variables. It is a way to represent data in a condensed form.
In this R tutorial, we learned about what contingency tables are. We studied how we create contingency tables in R and how to perform various operations on them like adding along their margins, calculating their proportionate values. We also learned what flat contingency tables are and how to create them in R. Finally, we learned about cross-tabulation and how do we recover data from the contingency table.
Now its time to learn Data Manipulation in R programming.
Any queries while executing these Contingency tables in R?
Don’t worry! Ask below, and our TechVidvan experts will be happy to help you.
Keep Executing!!