Graphical Models in R – Bayesian networks & Markov’s Random Field with example
Today we are going to learn about the graphical models in R. We will start by studying what graphical models are. Then, we shall move forward to the various types of graphical models. We will look at the most commonly used graphical models in R, which are the Bayesian networks and Markov’s random fields. Finally, we will learn about the common terminology regarding graphical models and conditional independence. So, without any further delays, let’s get cracking.
So, without any further delays, let’s get cracking.
What are graphical models in R?

Graphical models in R or probabilistic graphical models are statistical models that encode multivariate probabilistic distributions in the form of a graph. They use graphical representation to depict a distribution in a multi-dimensional space that is a compact representation of the set of independences in the distribution.
R Graphical models show conditional independence between random variables. They represent variable instances as nodes and independence assumptions between them as missing arcs. We can depict a graph mathematically as a function of the vertices and edges, or arcs between them.
![]()
Where V is the set of all the vertices,
![]() is a set of the edges or arcs between the vertices.
is a set of the edges or arcs between the vertices.
Types of graphical models
There are two types of graphical models based on the nature of the relationships between the variables. These are directed graphs and undirected graphs.
Let’s take a look at these models one by one.
Directed graphs
In directed graphs, all the edges have a specific direction that depicts the nature and dependence of the relationship between the two vertices at the end of the edge.
Directed graphs can contain cycles in them where the edges form a loop when we follow their directions. A graph that does not form such a cycle is called a Directed Acyclic Graph(DAG).
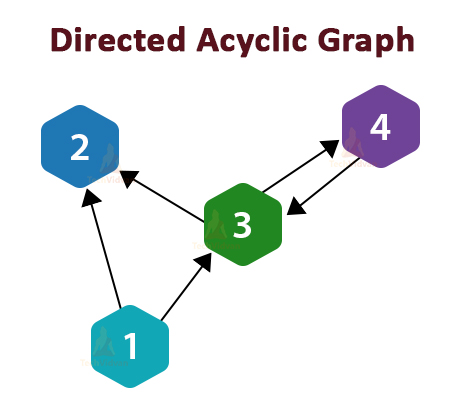
Bayesian networks
Bayesian networks are a type of Directed Acyclic Graphs. They represent conditional dependence between two variables(or vertices) as the edges between them. Bayesian Networks model conditional dependencies and causations as a DAG. The most common use of a Bayesian Network in simple terms is to take an event that has already occurred and to predict its cause of happening.
The relationships in a Bayesian network provide a compact and factorized representation of the joint probability distribution of the event. This will be easier to understand with an example.
Imagine a garden with sprinklers in it. If the grass in the garden is wet, it can either be due to the sprinklers or due to rain. If it is raining the sprinklers would be turned off. Here is a Bayesian network representing this situation.

Here, we will be using variables G, S and R to represent the Grass, Sprinkler, and Rain. Each variable can take the values of True or False. The joint probability function is as follows:
![]()
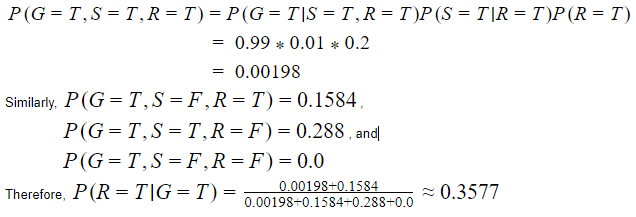
As stated before, Bayesian networks are useful to predict the cause of an event that has occurred. For example, this network could help us answer the question ”what is the probability that it rained if the grass is wet?”.
![]()
According to the joint probability function,
Undirected graphs
Undirected graphs do not have any specific direction associated with their edges. We can describe an undirected graph as
![]()
Where V is the set of all variables or node/vertices,
And E is an unordered set of all edges.
Undirected graphs are useful to represent probability distributions where the relationships between two variables, do not have a clear directionality.
Markov’s Random Field
Markov’s Random fields (MRF) are a way of graphically representing undirected probability distributions in the form of undirected graphs.
Suppose we have variables x1, x2, x3,….xn, then the Markov probability distribution p over these variables defined as an undirected graph G would be

Where C denotes a set of fully connected subgraphs of G,
![]()
is a non-negative function over C.
Also, Z is a partition function defined as
![]()
The partition function ensures that the value of the probability distribution remains below 1.0.
You must check the tutorial on Descriptive Statistics in R
Terminology of Graphical Models
Adjacent Nodes: Two nodes A and B are adjacent nodes if and only if there exists an edge AB that connects these two nodes in the graph.
Set of Neighbours: The set of neighbors of a node is the set of all nodes that are adjacent to that node. The set of neighbors of a node is also called the boundary of that node.
Degree of a Node: The degree of a node is the number of nodes in its set of neighbors.
Closure of a Node: The closure of a node is a set that includes the boundary of that node as well as the node itself.
Connected Nodes: Any two nodes in a graph G are connected if there exists a path between these two nodes that follows the edges that exist in the graph.
Subgraph: The subgraph of a graph is a subset of the graph’s edges and vertices.
What is Conditional Independence?
Any two variables A and B given C are conditionally independent if, given that event C occurs, the occurrence of event A does not give any information about B and the occurrence of event B does not give any information about A.
Summary
In this R tutorial, we learned about what graphical models are. We studied about directed and undirected graphs. We also looked at two graphical models that are most commonly used for depicting probabilistic distributions which are Bayesian networks and Markov’s Random Fields. Also, learned some common terminology about graphical models. Finally, we looked at what conditional independence is.
Now, explore how Data Manipulation in R programming works.
Any queries in these Graphical Models in R?
Don’t worry! Ask below, and our TechVidvan experts will be happy to help you.
Keep Executing!!