Saving Graphs to Files in R in Easy Steps
In the previous tutorials, we have been learning about various kinds of graphs and plots in R. In this chapter of the TechVidvan’s R tutorial series, we are going to look at how saving graphs to files in R works. We will also look at how to save the graphs in files manually by using the export option.
Saving graphs to files in R
It is quite simple to save graphs as files in R programming. R provides different functions to create different kinds of files. We can use these functions to save graphs in pdf, jpeg, png, and also as bmp files. So let’s take a look at these one-by-one.
1. Saving graphs as JPEG
We can create a jpeg file and then save a graph in it by using the jpeg() function.
jpeg("barplot.jpeg")
barplot(airquality$Ozone,
        main="Ozone concentration in air",
        xlab='ozone levels',
        col="blue",
        horiz=TRUE)
dev.off()
Output:
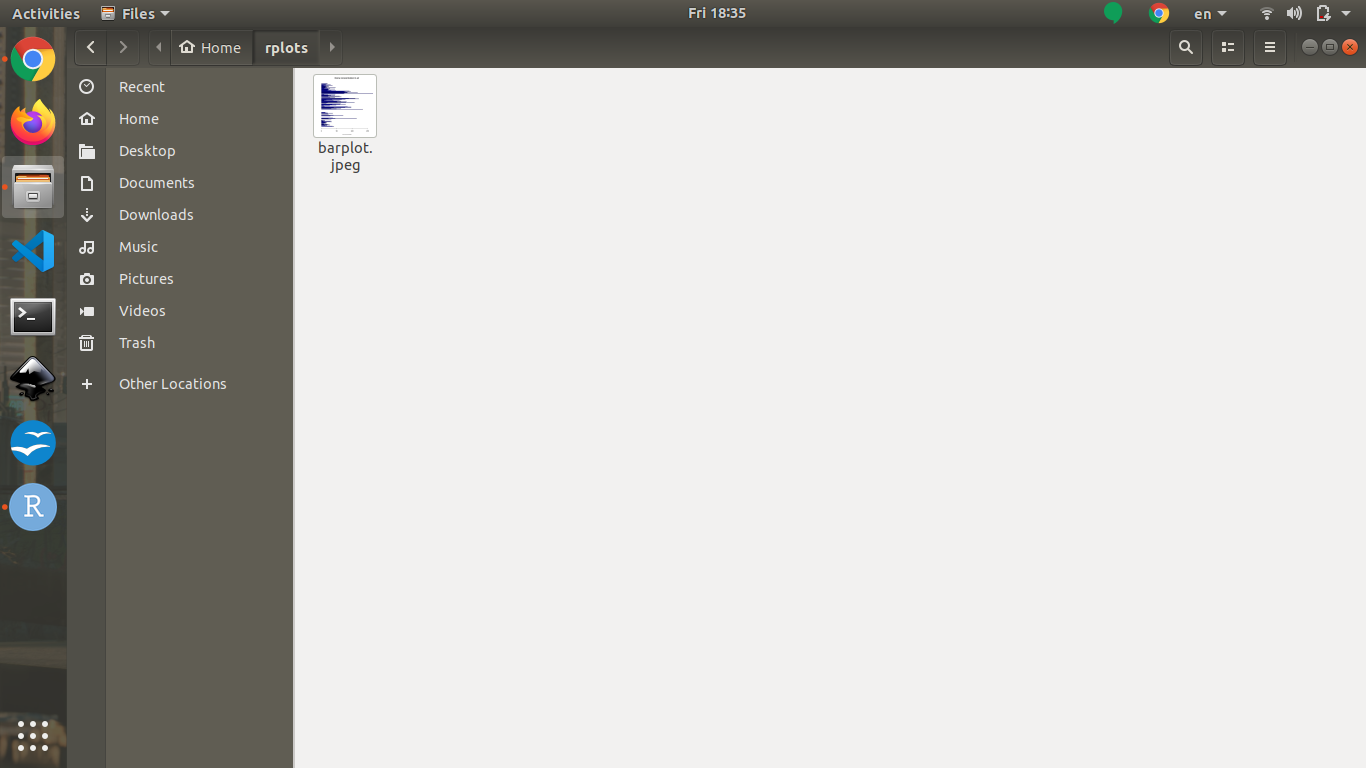
Using the jpeg command, we create a jpeg file. R starts storing all output into the file. We use the barplot() function to create the graph. This stores the graph into the jpeg file. Finally, we use the dev.off() command to stop recording and save the file.
2. Saving graphs as PNG
The png() function in R can create and save graphs in a png file.
png("barplot.png")
barplot(airquality$Ozone,
        main="Ozone concentration in air",
        xlab='ozone levels',
        col="blue",
        horiz=TRUE)
dev.off()
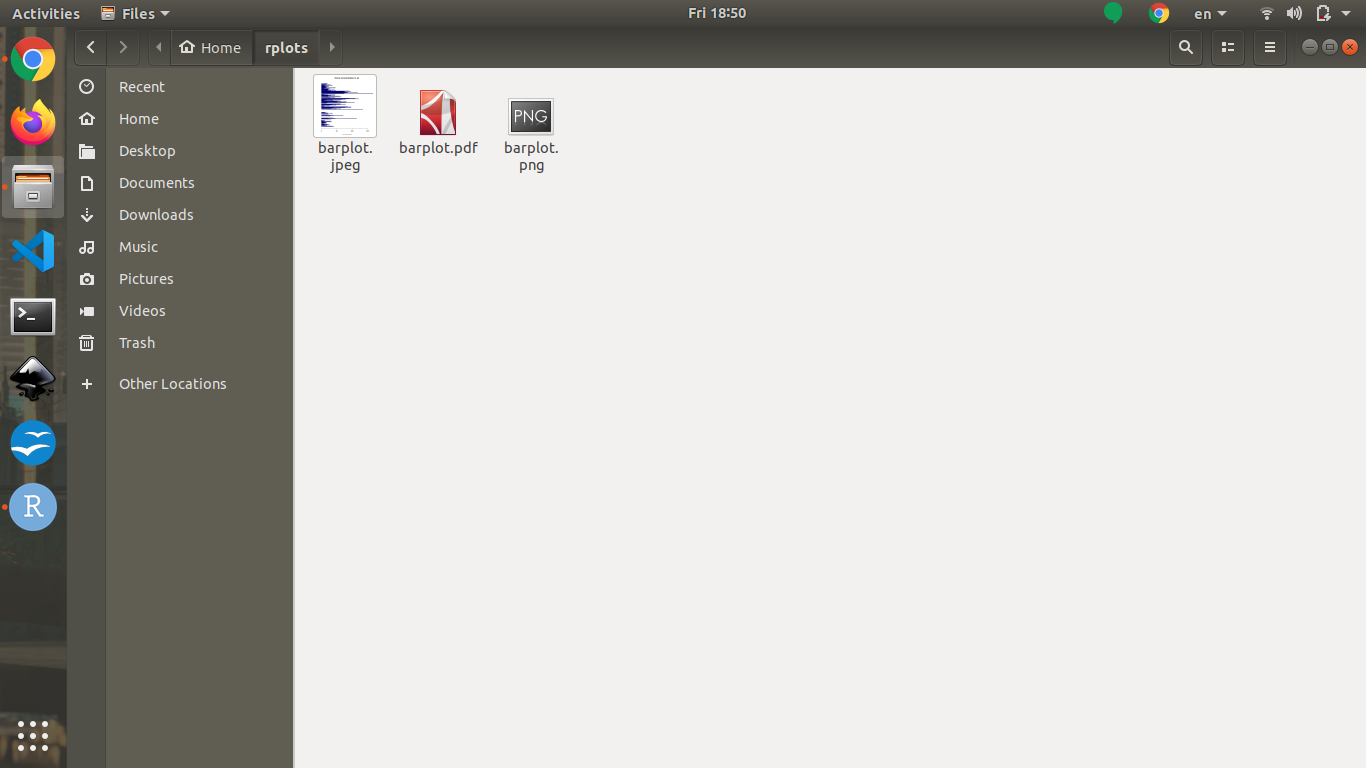
Output:

3. Saving graphs as PDF
We can use the pdf() function to save graphs as a pdf file.
pdf("barplot.pdf")
barplot(airquality$Ozone,
        main="Ozone concentration in air",
        xlab='ozone levels',
        col="blue",
        horiz=TRUE)
dev.off()
Output:
4. Saving graphs to Files in R using the export option
The plot window in Rstudio is where graphical outputs are shown. The plot window has an export option that can be used to store graphs as files. Let’s take a look at this.
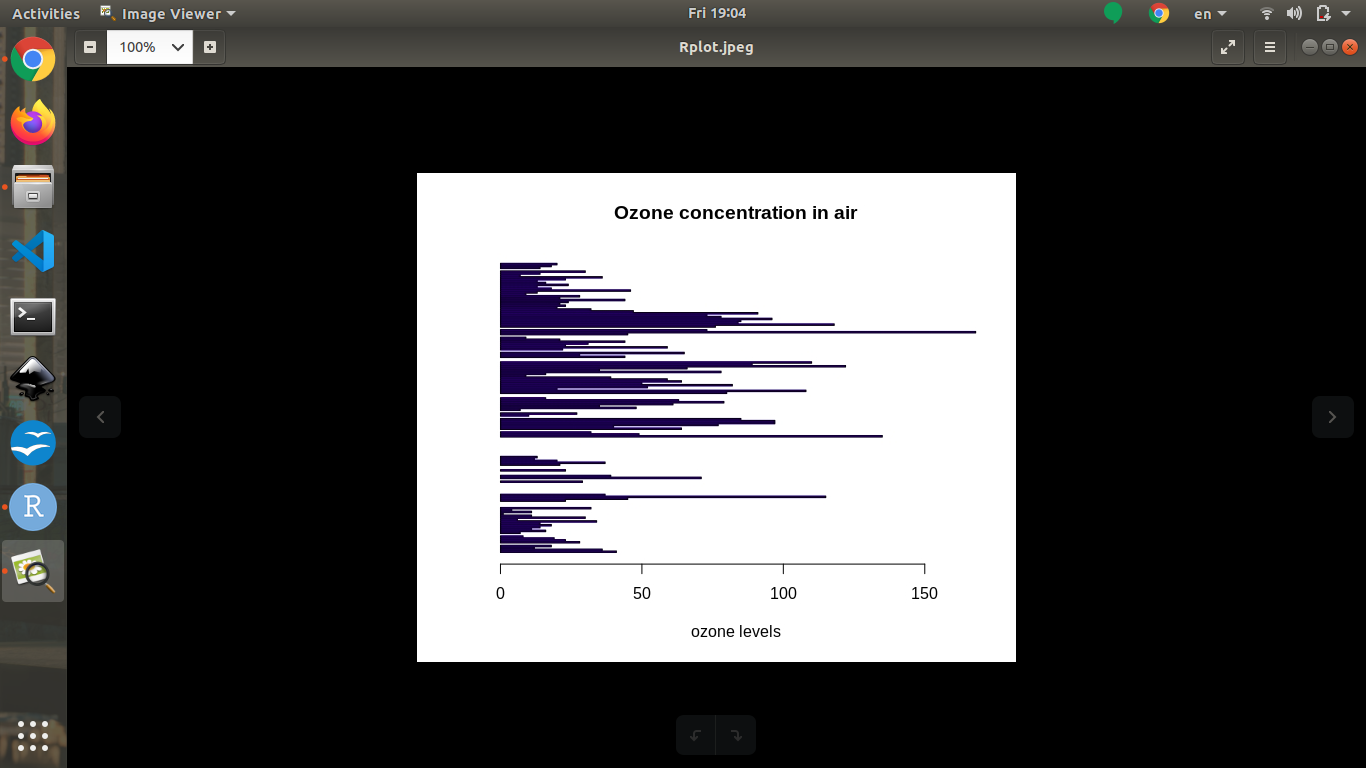
Step 1: Create a graph
You firstly need to create a graph as shown below:
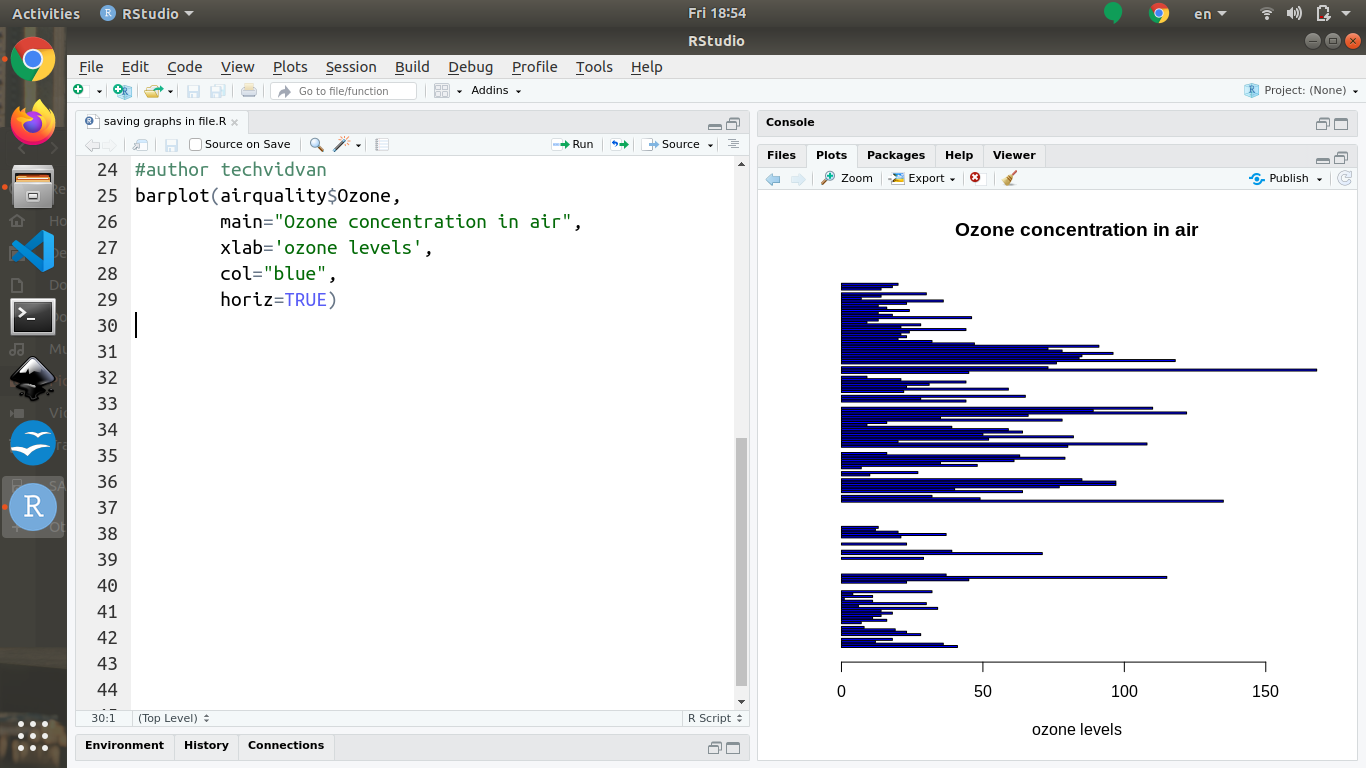
Step 2: Click on the export -> save as image
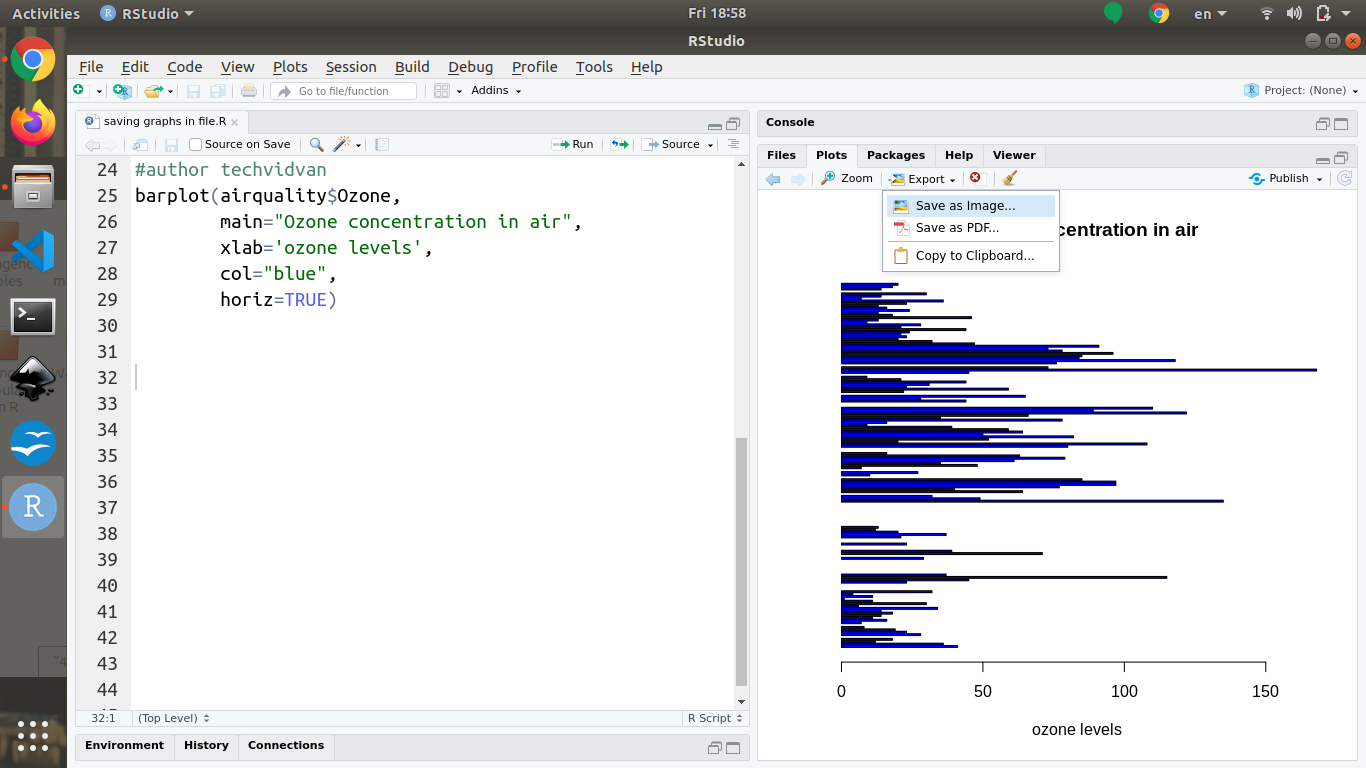
Step 3: You can then select the format of the output file.
Select the required format from the options as shown below:

Step 4: Click on save.
Summary
Finally we saw there are multiple ways for Saving graph to files in R. Depending on the required file format, we can use different functions, like the jpeg() function, or the png() function. Finally, we looked at the export option and how it can help us with saving graphs in files of our desired format.
Hope you enjoyed the article. Do follow us on LinkedIn to get updates on more published articles.